Driving rain on building facades is on of the largest sources of moisture that impacts durability of enclosures. Several approaches to predicting driving rain on buildings have been developed over the last 50 years. Field measurements have been collected on more than a dozen buildings in several different countries. Based on this research, and some CFD modeling studies, simplified approaches have been standardized in a British Standard and German guidelines. This digest consolidates and summarizes this research to provide a practical method for predicting driving rain deposition for a wide range of purposes, but particularly to aid in WUFI modelling and ASHRAE 160P analysis.
Background
The amount of water deposited on the above-grade building envelope by driving rain is larger than any other source of moisture in almost all building types and climates. Both the deposited rain absorbed by the cladding and water penetration of the cladding can be a significant source of moisture for many deterioration mechanisms. Despite the importance of driving rain to building performance, relatively little is known about the magnitude, duration, and frequency of driving rain and driving rain deposition on buildings.
Information about the magnitude and nature of the moisture load imposed by driving rain would be very useful and of practical value to many groups. Building science practitioners often require an in-depth understanding of driving rain load as inputs for computer models so that they can predict wall behavior with more accuracy and confidence. The design of tests for rain penetration resistance as part of quality control procedures, and the interpretation of such tests is also aided by an estimate of driving rain deposition.
Driving Rain
Driving rain is defined as the quantity of rain that passes through a vertical plane in the atmosphere. Driving rain occurs because raindrops which are falling to the ground at their terminal velocity are blown sideways at the speed of the wind at any given height above grade (Figure 1).
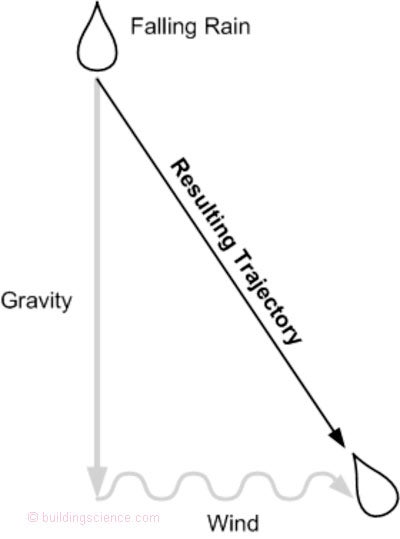
Figure 1
The amount of driving rain in unobstructed wind flow can be calculated with reasonable accuracy. The speed at which raindrops fall is a function of the size of the drop. Essentially, as the drop size increases the rain drop terminal speed increases at a decreasing rate. The wind carries the drops along horizontally due to drag. The combination of gravity and wind forces determines the trajectory of the drop, and simple geometry can then be used to assess the amount of rain passing through a vertical plane. Complicating this assessment is the fact that there is a range of raindrop sizes in any rainstorm. Research by various meteorologists can be used to correlate the distribution of drop sizes in a rainstorm with the intensity of the rainfall.
Subsequent theoretical work and a considerable amount of field measurement [Straube 1998] has allowed us to extend and generalize Equation 3 to
rv = DRF · V(z) · rh (4)
where V(z) is the wind speed at, z, the height of interest (m/s),
The proportionality constant in Equation (4), is the ratio of rain on a vertical plane (driving rain) to rain on a horizontal plane (falling rain) and has been defined [Straube & Burnett 1997] as the driving rain factor (DRF). From simple geometry, it can be seen that the Driving Rain Factor is equal to the inverse of the terminal drop velocity:
DRF =1/Vt (5)
Field studies at the University of Waterloo [Straube & Burnett 1997], in Germany [Kuenzel 1994] and computer models [Choi 1994] have found that the value for the DRF ranges between 0.20 to 0.25 for average conditions. This is the reason that the simple semi-empirical Lacy equation was so successful. However, DRF does vary considerably for different rainfall intensities and rain storm types. For example, it can range from more than 0.5 for drizzle to as little as 0.15 for intense cloudbursts.
The cosine of the angle between the plane of interest and the direction of the wind can be used to account for wind direction on a plane oriented in a specific direction.
rv = DRF · V(z) · rh· cos θ (6)
where θ is the angle between a line drawn perpendicular to the wall of interest and the wind direction.
Experimental work [Straube 1998] has shown that the quantity of driving rain in an unobstructed wind flow can be calculated with an accuracy of better than 10% using Equations 2, 5 and 6, provided the median raindrop diameter predicted by Equation 1 is used.
Building Shape and Aerodynamics
When wind encounters a building, streamlines and pressure gradients form around it. While it is clear that driving rain is re-directed by these streams of air (since the droplets are carried with the wind), accounting for this effect is difficult.
A simple and practical approach for estimating rain deposition on buildings is to divide driving rain deposition into the effects of the undisturbed wind (the free wind driving rain, a climate and site specific value) and the effect of the aerodynamics and geometry of the local building. A linear factor, the rain deposition factor (RDF), can be used to transforms the rate of driving rain in the free wind (i.e. outside of the region disturbed by a building) to the rate of rain deposition on a particular building (Straube 1998). For a particular orientation and spot on the building face, the free wind driving rain values can be modified as:
rvb = RDF · DRF · V(z) · cos (θ ) · rh (7)
where rvb is the rain deposition rate on a vertical building surface(l/m2/h),
RDF is the Rain Deposition Factor, the ratio of rain in the free wind to rain deposition on a building, which accounts for the effect of building shape and size on rain deposition.
DRF is the Driving Rain Factor, which accounts for interaction of the wind and rain in the undisturbed wind,
θ is the angle between the normal to the wall and the wind direction, and
V(z) is the windspeed in m/s at z meters above grade.
Wind Exposure Corrections
Given hourly wind speed, direction, and rainfall rate, Equation 6 can be used to predict driving rain in the free wind, away from obstructions and buildings, at the height of the wind gauge. These climatic and directionally specific results must then be modified by the use of linear factors to account for building geometry/shape, height, upstream roughness, and topographic features.
Building Shape
Building shape and overhang effects can be accommodated through the use of different Rain Deposition Factors (RDF).
The RDF is a function of the building's shape, aerodynamics, the wind's angle of attack, raindrop diameter, and wind speed. In general, since most rain events are of low intensity and have a similar distribution of raindrop sizes, average values of RDF measured in the field over a range of driving rain events have shown somewhat consistent results (Straube 1998) and have been shown to be capable of predicting a special case on a 15 minute basis (Straube 1997). It is interesting to note that recent computer modeling backed by field measurements (Blocken and Carmeliet 2004) have recently provided strong evidence that a single RDF factor independent of rainfall intensity is a reasonable approximation over a broad range of rainfall intensities. Again, this conclusion would need to be confirmed in hurricane regions because of their different pattern of rain and wind. The most important dependencies are with the building shape and aerodynamics, and hence these are investigated below.
Other than Straube (1997, 1998) and Schwarz (1973) the literature contains few references of simultaneous measurements of driving rain in the environment and the driving-rain deposition on a building. However, when results from the literature of field measurements (Schwarz 1973, Frank 1973, Sandin 1988, Flori 1992, Henriques 1992, Kuenzel 1994, Straube 1998, Blocken and Carmeliet 2000), wind tunnel tests (Inculet 1994), and computer modeling (Choi 1994, Karagiozis et al 1997, Blocken and Carmeliet 2000) are evaluated in terms of calculated RDF there is a reasonable agreement of results. Until the results of further research are available, the RDF values given in Figure 2 (compiled from the references listed) are recommended. An RDF of 1.0 appears to be appropriate near the upper corners of blunt-edged, rectangular buildings. Over small areas with unusual or complex geometries (eg. notches in the elevation of a building), much higher RDF values may be more realistic. An RDF of much less than one is likely over most areas of most buildings, but the upper corners of high rise buildings could have limited areas of much greater than one.
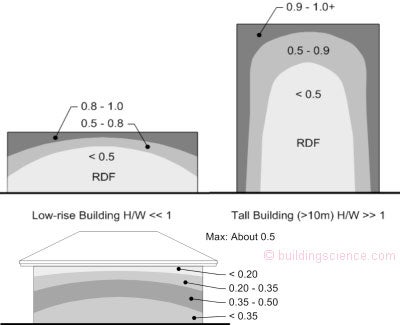
Figure 2: Rain deposition factor (RDF)
Peaked roofs and overhangs redirect airflow up and over the building at a distance further from the facade (Figure 3) and can thereby have a significant effect on rain deposition (regardless of the building size). This has been shown at the one-storey UW Beghut (Straube 1998), unpublished measurements conducted for MEWS (on a 4 storey apartment) and in wind tunnel studies of a high-rise apartment building (Inculet and Surry 1995). For example, adding a 1.5 m wide canopy to a multi-storey building will result in a lower RDF value and can, in theory, be an effective and economical means of improving rain control. Similarly, a peaked roof not only leaks less than a low-slope roof, it may also reduce the amount of driving rain on walls by deflecting the wind (Straube 1998).
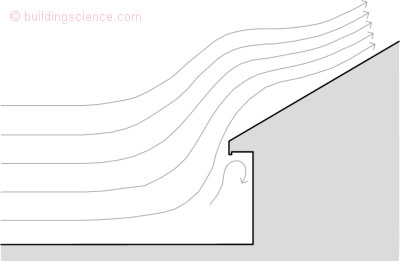
Figure 3: Influence of overhangs on wind around buildings
It is clear from Equation 7 that rain deposition will increase directly with wind speed. Hence, building facades exposed to high wind speeds are also exposed to higher levels of driving rain. Equation 7 is only accurate if the wind speed at the height of interest is applied and the influence of terrain and site features are accounted for in the velocity used. Weather data files almost always provide the unobstructed wind speed at 10 m (33 ft) above grade. Wind speeds increase with height above grade and are accelerated close to the ground on hilltops, and will be higher in exposed conditions (open country) than for buildings protected by other houses, trees or by hills. To correct for height, the type of upwind terrain roughness, and sharp terrain features, such as hills and escarpments, the wind speed, used in driving rain calculations, must be modified.
Height and Upwind Roughness
The fact that wind speed increases rather rapidly with height means that the driving rain exposure of tall buildings is much higher than for low-rise buildings. The standard approach used to correct wind speed with height is provided in ASCE 7 and the National Building Code of Canada (NBCC 1996). The wind speed at any height, V(z) can be found from:
V(z) = V10 · (z/10) α (8)
Where V10 is the standard wind speed 33 ft (10 m) above grade normally reported by weather stations (m/s),
z is the height above grade (in meters) and
α is the exposure exponent, shown in Figure 5.
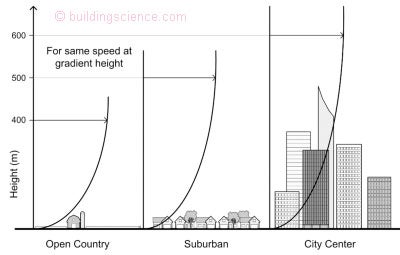
Figure 4: Different upwind exposure types
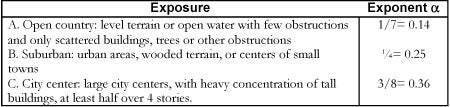
Figure 5: Exponent for different upwind exposure
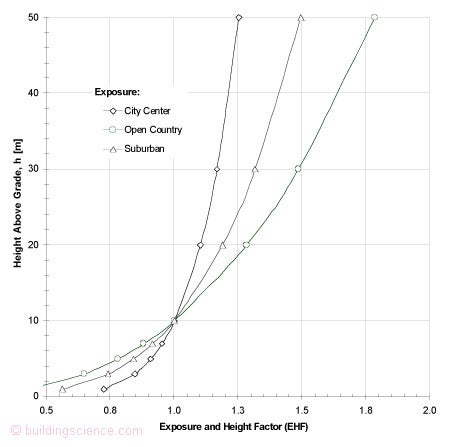
The increase in velocity with height has been calculated for the three different exposure classes and the results summarized in Figure 6 and plotted in Figure 7.
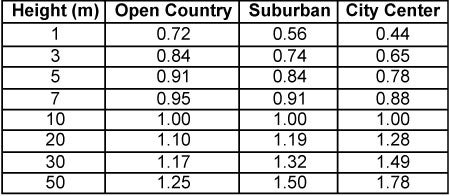
Figure 6: Wind velocity multipliers (EHF) for different heights and exposures
Recommended multiplication factors to apply to above:
Sheltered: 0.5 if buildings or obstruction of building height are within a distance equal to twice the building height
Hilltop or Cliff top: See speed-up correction factor in text
Figure 7: Correction factors for different exposures and heights (EHF)
This exposure and height factor (EHF) can be used directly to adjust the amount of driving rain predicted by Equation 7.
Hills and Escarpments
It is well known that wind speed increases as it is forced over hills and escarpments. The higher wind speeds result in higher driving rain deposition and higher wind pressures on buildings, and experience suggests that more rain penetration problems occur. The speed-up factor can be calculated with the aid of the NBCC as well. Figure 8. defines the variables needed to use the following equation to find the wind speed corrected for topography (NBCC 1996):
TF = {1 + ΔSmax {1 – |x| / (k · L) } e(-az / L) }½ (9)
Where TF is the topography wind speed correction factor,
H and L are topographic geometric values defined in Figure 8. (m),
x is the distance from the crest (m),
z is the height above the crest (m)
k, ΔSmax and a can be found in Figure 8.
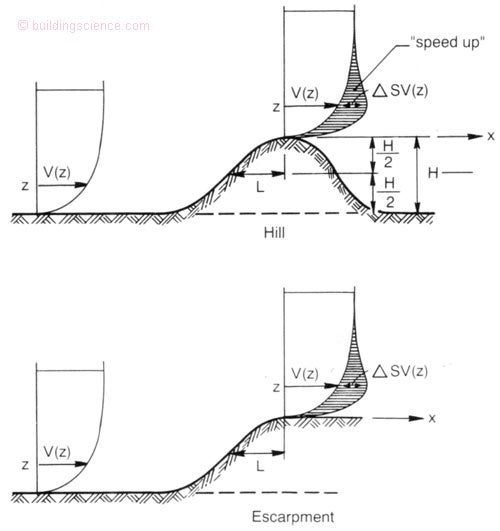
Figure 8: Speed-up factor definitions (NBCC 1996)
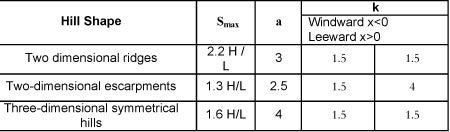
Figure 9a: Parameters for topography factor calculations (NBCC 1996)
To provide a sense of the size of the TOF , an example calculation has summarized in Figure 9.
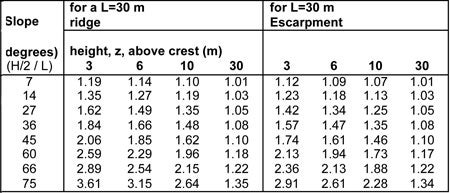
Figure 9b: Topography factor example calculations
The Building Research Establishment (BRE 1984) has also published a simplified method of accounting for wind accelerating over different types of terrain and provides more detailed information than the NBCC method.
Driving Rain Loads for Design
To apply all of the foregoing, a designer needs to
- find the driving rain load on a building, rbv, for the nearest climate region and specific orientation (Equation 6),
- assess the building geometry and select an appropriate RDF,
- consider the upwind exposure and height of interest on the building (EHF), and
- apply a topography (TOF) factor if needed.
Given these values the design load can be found from:
Design Driving Rain Load = rbv · RDF · EHF · TOF (13)
where the annual driving rain load is in kg/m2 or l/m2 or inch/yr or gallons/sf/year.
The same factors are used to find the driving rain load from the worst direction, the annual total, or other values.
Example
As an example of using the data and methods described, consider two different walls in Toronto, one facing east and one west. Inspection of the Toronto driving rain graph in Figure 10 shows a free wind driving rain quantity of 6.8 inch/yr (170 mm/yr) for the west and 15.1 inch/year (380 mm/yr) for the east. If one considers a west-facing bungalow wall 9 ft (2.7 m) above grade, sheltered by closely spaced houses in a suburb, the 6.8 inch/yr would be modifying by a factor of 0.7 (from Figure 7) and a further reduction factor of 0.5 (from the note on sheltering). If the bungalow had a peaked roof with a 12” (300 mm) overhang, an RDF of 0.5 would capture the highest likely rain deposition values. The result would be a driving rain total of 6.8*0.7*0.5*0.5= 1.2 inch/year or 30 mm per year, which is equivalent to 30 liters per m2 or 0.75 gallons/square foot per year.
For an east-facing wall on the top floor of a 50 m (175 ft) tall blunt edged (RDF=1.0) condominium in a suburban exposure, Figure 6 provides a wind speed correction factor of 1.5. Using an RDF of 1.0 for the top corners, the driving rain deposition would be predicted to be 15.1 * 1.5 * 1.0 * 1.0 = 22.6 inch/yr or 575 mm per year which is 575 l/m2/year or 14.1 gallon/f2/yr– almost 20 times as much rain as the sheltered low-rise bungalow wall facing west.
This example demonstrates the very significant influence of exposure and orientation in a specific climate. It should also be noted that the combination of high exposure and choice of building shape (high RDF) in a low driving rain climate (such as Phoenix) can result in much more rain deposition than a sheltered low rise building in a high driving rain climate (such as Seattle).
Summary
These data and methodology, although partially validated through field measurements, should be used with care and professional judgment. Many more field measurements of tall and complex building shapes are needed, as are measurements in a range of exposure conditions. Computational Fluid Dynamic approaches have been successful in intense research programs where they could be calibrated to measured data on test buildings: their accuracy and reliability are not likely any better than the simple methods presented here for the prediction of rain loads of buildings without measurements.
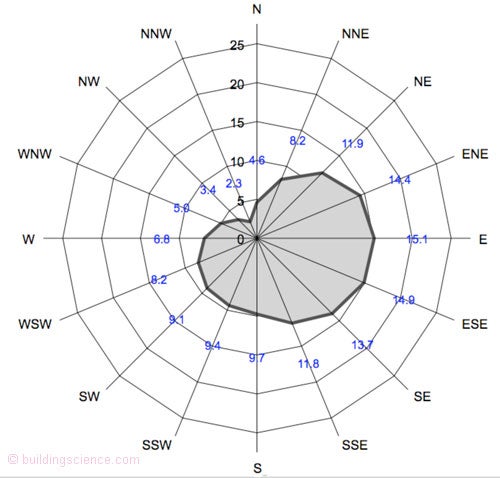
Figure 10: Driving Rain Rose for Toronto Canada (inch/year)
References
AES. Software Implementation for Climatological Ice Accretion Modeling Project, Internal Report to Energy and Industrial Applications Section, Atmospheric Environment Service, Canadian Climate Center, Toronto, Canada, 1984.
Barry, R.G., and Chorley, R.J., Atmosphere Weather and Climate, 6 ed., Routledge, New York, 1992.
Beard, K.V., "Terminal Velocity and Shape of Cloud and Precipitation Drops Aloft", J. of the Atmospheric Sciences, Vol. 33, 1976, pp. 851-864.
Best, A.C., "The Size Distribution of Raindrops", Quart. J. Royal Meteor. Soc., Vol. 76, 1950, pp. 16-36.
Blocken, B., Carmeliet, J. “A Simplified Approach for Quantifying Driving Rain on Buildings”, Proc. Of Performance of Exterior Envelopes of Whole Buildings IX, Clearwater, Dec. 2004.
Blocken, B., Carmeliet, J., “Driving Rain on Building Envelopes I: Numerical estimation and Full-scale Experimental Verification”, J. of Thermal Envelope and Building Science Vol 24, No. 1, 2000, pp. 61-85.
Boyd, D.W., “Driving-Rain Map of Canada”, DBR/National Research Council, TN 398, Ottawa, 1963.
Bradley, S.G., and Stow, C.D., "The Measurement of Charge and Size of Raindrops: Part II. Results and Analysis at Ground Level", J. of Appl. Meteor., Vol 13, Feb 1974, pp. 131 - 147.
BRE, The Assessment of Wind Speed over Topography. Digest 283, Building Research Establishment, Garston, U.K, March 1984.
Caton, P.G., "A study of the raindrop-size distributions in the free atmosphere", Quart. J. Royal Meteor. Soc., Vol 92, 1966, pp. 15-30.
Choi, E.C.C., “Simulation of Wind-Driven Rain Around a Building”, Journal of Wind Engineering and Industrial Aerodynamics, Vol 46-47, 1993, pp. 721-729.
Choi, E.C.C.. Determination of the wind-driven-rain intensity on building faces. Journal of Wind Engineering and Industrial Aerodynamics, Vol 51, 1994, pp. 55-69.
Dingle, A.N. and Hardy, K.R., "The description of rain by means of sequential rainddrop-size distributions", Quart. J. Royal Meteor. Soc., Vol. 88, 1962, pp. 301-314.
Dingle, A.N., and Lee, Y., "Terminal Fall Speeds of Raindrops", J. of Appl. Meteor., Vol 11, August 1972, pp. 877 - 879.
Flori, J-P., Influence des Conditions Climatiques sur le Mouillage et le sechalge d'une Facade Vertical. Cahiers du CTSB 2606, September, 1992.
Frank, W., Entwicklung von Regen and Wind auf Gebaeudefassaden, Verlag Ernst & Sohn, Berichte aus der Bauforschung, Vol 86, 1973 pp. 17-40.
Grimm, C.T., "A Driving Rain Index for Masonry Walls", Masonry: Materials, Properties, and Performance, ASTM STP 778, J.G. Borchelt, Ed., American Society of Testing and Materials, 1982, pp. 171-177.
Gunn, R, and Kinzer, G.D., "The terminal velocity of fall for water drops in stagnant air", J. Meteor., Vol 6, 1949 pp. 243-248.
Handbook on the Principles of Hydrology, ed. Donald M. Grey, National Research Council of Canada, Ottawa, 1970, pp. 2.2-2.3.
Henriques, F.M.A.. "Quantification of wind-driven rain - an experimental approach", Building Research and Information, Vol. 20, No. 5, 1992, pp. 295-297.
Inculet, D. and Surry, D.. Simulation of Wind Driven Rain and Wetting Patterns on Buildings. A report published by the CMHC, February 1995.
Karagiozis, A., and Hadjisophocieous, G.,”Wind-Driven Rain on High-Rise Buildings”, Proc. of the BETEC/DOE/ASHRAE Thermal Performance of Building Envelopes VI, Dec. 1995, pp. 399-406.
Karagiozis, A., Hadjisophocieous, G., and Cao, S., "Wind-Driven Rain Distributions on Two Buildings", J. of Wind Engineering and Industrial Aerodynamics, Vol 67 and 68, 1997, pp. 559-572.
Künzel, H.M.. Regendaten für Berechnung des Feuchtetransports, Fraunhofer Institut für Bauphysik, Mitteilung 265, 1994.
Lacasse, M. A., O’Connor, T.J., Nunes, S., Beaulieu, P. 2003. Experimental Assessment of Water Penetration and Entry into Wood-Frame Wall Specimens - Final Report. MEWS Consortium, IRC/NRCC,Ottawa, February, 2003.
Lacy, R.E., “Driving-Rain Maps and the Onslaught of Rain on Buildings”, Proc. of RILEM/CIB Symposium on Moisture Problems in Buildings, Helsinki, (Building Research Station Current Paper 54, HMSO Garston, U.K) 1965.
Laws, J.O., and Parsons, D.A., "Relation of raindrop size to intensity", American Geophys. Union Trans., No. 24, pt. 2, 1943, pp. 453-460.
Levelton Engineering, Wind-Rain Relationships in Southwestern British Columbia – Final Report. Research report for CMHC, Ottawa, August 2004.
Markowitz, A.M., "Raindrop Size Distribution Expressions", J. of Applied Meteorology, Vol. 15, 1976, pp. 1029-1031.
Marshall, J. S., and Palmer, W. M., "The distribution of raindrops with size", J of Meteor., Vol. 5, Aug. 1948, pp.165-166.
NBCC, Users Guide -to National Building Code of Canada 1995 Structural Commentaries (Part 4). Canadian Commission on Building and Fire Codes, National Research Council, Canada,1996.
Rain Penetration Control Guide. CMHC Report, Ottawa, 2000.
Rogers, R.R., and Pilie, R.J.,"Radar Measurements of Drop-Size Distribution", J. of the Atmospheric Sciences, Vol 10, Nov. 1962, pp. 503-506.
Sandin, K., “The Moisture Conditions in Aerated Lightweight Concrete Walls”. Proc. of Symposium and Day of Building Physics, Lund University, Swedish Council for Building Research 1988, pp. 216-220..
Schwarz, B., Witterungsbeansphruchung von Hochhausfassaden. HLH Bd. 24, Nr. 12, 1973, pp. 376-384.
Skerlj, P.F., A Critical Assessment of the Driving Rain Wind Pressures Used in CSA Standard CAN/CSA-A44-M90. M.A.Sc. Thesis, Faculty of Engineering Science, University of Western Ontario, London, Canada, 1999.
Straube, J.F. Burnett, E.F.P., "Rain Control and Design Strategies". J. of Thermal Insulation and Building Envelopes, July, 1999, pp. 41-56.
Straube, J.F. Moisture Control and Enclosure Wall Systems. Ph.D. Thesis, Civil Engineering Department, University of Waterloo, Waterloo, Canada, 1998.
Straube, J.F., Burnett, E.F.P. "Driving Rain and Masonry Veneer", Water Leakage Through Building Facades, ASTM STP 1314, R.J. Kudder and J.L. Erdly, Eds., American Society for Testing and Materials, Philadelphia, 1997, pp. 73-87.
Straube, J.F., Burnett, E.F.P., “Rain Control and Screened Walls”, Proc. of the 7th CSCE Building Science and Technology Conference, Toronto, March, 1997, pp. 17-38.
Straube, J.F., Burnett, E.F.P.. "Pressure Moderation and Rain Control for Multi-Wythe Masonry Walls". Proc of International Building Physics Conference , Eindhoven, September 18-21, 2000, pp. 179-186.
Surry, D., Skerlj, P. , Mikitiuk, M.J., An Exploratory Study of the Climatic Relationships between Rain and Wind, (Final Report BLWT-SS22-1994, Faculty of Engineering Science, University of Western Ontario), CMHC Research Report, Ottawa, February 1995.
Van Mook, F.J.. “Measurements and simulations of driving rain on the main building of the TUE” Proc. Of 5th Symposium on Building Physics in the Nordic Countries, Goteborg, Sweden, August, 1999, pp. 377-384.
Welsh, L.E., Skinner,, W.R., and Morris, R.J., A Climatology of Driving Rain Wind Pressures for Canada. Climate and Atmospheric Research Directorate, Draft Report, Environment Canada, Canada, 1989.
Wisse, J.A., “Driving Rain a numerical study”, Proc. Of 9th Symp. On Building Physics and Building Climatology, Dresden, Germany, Sept. 1994.