This report considers a number of promising wall systems that can meet the requirement for better thermal control. Unlike previous studies, this one considers performance in a more realistic matter, including some two- and three-dimensional heat flow and analysis of the relative risk of moisture damage.
Introduction
Many concerns, including the rising cost of energy, climate change concerns, and demands for increased comfort, have lead to the desire for increased insulation levels in many new and existing buildings. Building codes are being modified to require higher levels of thermal control than ever before. The manner in which additional thermal insulation is added to framed wall assemblies is critical to their durability when considered over time. This report considers a number of promising wall systems that can meet the requirement for better thermal control. Unlike previous studies, this one considers performance in a more realistic matter, including some two and three-dimensional heat flow and analysis of the relative risk of moisture damage.
In some cases, increasing the quantity of insulation may result in an increased risk of moisturerelated issues when the exterior surfaces of the enclosure are kept colder in cold weather, and the interior surfaces are kept cooler in warm weather. This may result in increased condensation, and increased freeze thaw potential or decay potential of the assembly in different situations. Analysis is required to predict the potential hygrothermal risks due to increasing the amount of insulation (R-value) in the enclosure.
Previous work, largely stemming from research in the 1970’s and 1980’s, involved postulating newer assemblies with improved R-values. R-value was, and often still is, defined as the “clear wall” R-value (no framing effects accounted for) or the total amount of insulation installed in the assembly. The increased moisture risks were rarely considered.
Building Science Consulting has conducted field testing of full scale test walls in an field exposure hut on the lower mainland of British Columbia, which experiences similar temperatures and moisture loads to both Portland OR, and Seattle WA, and some of those results will be shown here to compare actual measured results in the field to predicted results by hygrothermal simulations.
Objective
The objective of this study is to compare commonly built construction techniques in the Pacific Northwest with some promising less commonly constructed wall systems based on selected criteria, resulting in a durable, but affordable, and resource efficient wall system that provides a comfortable living environment in Portland, OR, Seattle, WA and the surrounding areas. This report will present the analysis of different enclosure wall strategies and present their advantages and disadvantages according to several comparison criteria.
Scope
This study was conducted specifically for Portland OR, but is mostly applicable throughout the Pacific Northwest. Construction techniques vary locally, and nationally, but with local guidance, the most typical wall construction strategies were simulated for this report. Some higher R-value walls were also included that may not be as commonly constructed to assess the advantages and disadvantages of higher R-value wall systems.
Approach
This study examines thermal and moisture control, durability, constructability, cost and material use. The quantitative analysis for each wall system is based on a two-dimensional steady-state heat flow modeling program and a one-dimensional dynamic heat and moisture (hygrothermal) model. Portland OR, in IECC climate Zone 4C was used for all of the hygrothermal analysis.
Analysis
Wall Assemblies Reviewed
There are a number of variables possible for each wall system depending on the local practices,
climate, and architect or general contractor preferences. An attempt was made to choose the
exterior wall systems most commonly used in the Pacific Northwest and make notes and
comments about other possible alternatives during the analysis. Some of the wall systems
selected for analysis are not common to the Pacific Northwest but are used in other locations and
may be good wall construction options in the Pacific Northwest. This list of chosen systems is
explained in more detail in the analysis section for each wall system. In some cases, small
variations were made to the chosen walls and a sensitivity analysis was conducted. For example
the smart vapor retarder (SVR) may be changed to a kraft paper vapor control to determine the
importance of the vapor control layer. A smart vapor retarder provides variable vapor permeance
by altering the vapor permeance depending on the surrounding relative humidity. These analysis
are not reflected in the wall list, but are identified later in the analysis sections.
- Wall 1 : Standard construction with 2x6 framing
- Wall 2 : Advanced framing
- Wall 2b : Advanced framing with OSB sheathing
- Wall 3 : Advanced framing with 1” of exterior XPS insulation
- Wall 4 : Advanced framing with 2” of exterior XPS insulation
- Wall 5 : Advanced framing with 4” of exterior XPS insulation
- Wall 6 : Advanced framing with 1” of exterior XPS insulation and blown cellulose in the stud cavity
- Wall 7 : Advanced framing with 2x8 construction
- Wall 8 : Advanced framing with 2x8 construction and 1” of exterior XPS insulation
- Wall 9 : Standard construction with 2x4 framing, 2” of exterior XPS insulation and no insulation in the stud cavity
- Wall 10 : Standard construction with 2x4 framing, 2” of exterior XPS insulation and fiberglass batt insulation in the stud cavity
- Wall 11: Advanced framing with 0.5 pcf spray foam
- Wall 12: Advanced framing with 2.0 pcf spray foam
- Wall 13: Hybrid wall with 2.0 pcf spray foam and fiberglass batt (i.e. “flash and batt”)
- Wall 14: Double stud wall with an exterior structural wall
- Wall 15: Double stud wall with an interior structural wall
- Wall 16: Structural Insulated Panels (SIPs)
- Wall 17: Insulated Concrete Forms (ICF)
Analysis Criteria
A comparison matrix will be used to quantitatively compare all of the different wall system strategies. A value between 1 (poor performance) and 5 (excellent performance) will be assigned, upon review of the analysis, to each of the comparison criteria for each wall. An empty comparison matrix is shown below in Table 1 as an example.
Table 1: Criteria comparison matrix
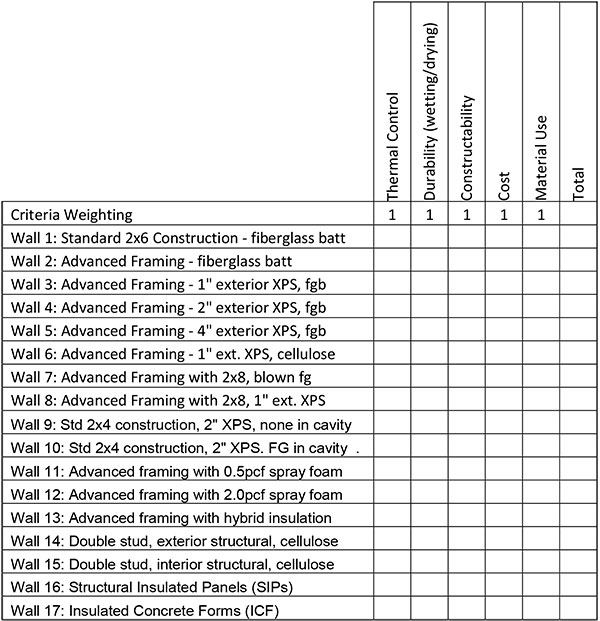
The criteria scores will be summed for each test wall, and the walls with the highest scores are the preferred options assuming all of the comparison criteria are weighted equally. It is also possible to weight the different comparison criteria asymmetrically depending on the circumstances surrounding a particular building design and the goals involved in the design of that building. For example, durability or cost may be considered more important than thermal control or energy performance by some design teams or may be weighted equally by others. The weightings for each wall will fall between 1 (least important) and 5 (most important). The weighting is multiplied by the comparison criteria score and added to other weighted values. An example of the weighted conclusion matrix will be shown in the Conclusions section.
One of the benefits of using a comparison matrix is that it allows a quantitative comparison when some of the criteria, such as cost may be poorly defined or highly variable. For example, even though the exact amounts of different materials may be uncertain for the Material Use criteria, standard construction will use less framing lumber than double stud walls, but use more framing lumber than advanced framing in the same wall system, so these systems can be ranked accordingly regardless of the actual material consumed. The cost analysis in this report represents the current Portland, OR construction market at the time of writing.
Heat flow analysis
Two and three dimensional heat flow analysis was conducted for each test wall using THERM 5.2, a two-dimensional steady-state finite element software package developed by the Lawrence Berkeley National Laboratory at the University of California. Three-dimensional heat flow analysis was conducted by modeling the assembly in one view (e.g. plan view) and then using an effective conductivity for the measured assembly in a different view (e.g. elevation view). Therm was used to calculate the thermal performance of each of the different proposed assemblies including thermal bridging effects.
In many cases, it is generally assumed that installing an R13 fiberglass batt into a 2x4 stud wall leads to wall performance of R13. This does not take into account thermal bridging of the wall framing including the studs, rim joist and top and bottom plates which allows heat to bypass the insulation, decreasing the whole wall R-value. Therm can predict the impact of thermal bridging and determine a whole wall R-value that considers the rim joist, wall framing and top and bottom plate(s).
The effect of thermal bridging and different framing details requires a metric more complex than just a single R-value to allow for meaningful comparisons. Five R-values have been and are used in the building industry. Oak Ridge National Labs (ORNL) proposed a number of definitions (Christian and Kosny 1995). We have found it useful to add some and extend their definitions.
- Installed Insulation R-value
This R-value is commonly referenced in building codes and used by industry. This is simply the R-value labeled on the product installed in the assembly. - Center-of-Cavity R-value
The R-value at a line through an assembly that contains the most insulation, and the least framing, typically, the middle of a stud-bay in framed construction. - Clear wall R-value
R-value of an assembly containing only insulation and minimum necessary framing materials at a clear section with no windows, corners, columns, architectural details, or interfaces with roofs, foundations or other walls. - Whole-wall R-value
R-value for the whole opaque assembly including all additional structural elements (such as double studs), and typical enclosure interface details, including wall/wall (corners), wall /roof, and wall/floor connections. - True R-value
The R-value of an enclosure assembly that includes all thermal bridging, air leakage, wind washing, convective loops, radiation enhancements, thermal and hygric mass, and installation defects.
Each of these measures is progressively more realistic. The True R-value is very difficult to measure without field samples.
The whole-wall R-value will be approximated in this analysis. To accurately calculate this whole-wall R-value, the wall in question was divided into three sections, modeled individually, and then the results were combined.
The R-value of the wall section was simulated in plan view to best represent the thermal bridging effects of wall studs as shown in Figure 1. This section is similar to a clear-wall R-value except that the studs are placed closer together to more accurately represent actual numbers of wood framing elements used in real wall systems. The height of the wall section for simulation purposes is 96 inches. . .
Donwload complete report here.