Imagine a three-dimensional molecular billiard game with billiard balls that are sometimes sticky, and where the rules depend on where you are on the table. Then assume that there are many different types of tables and pockets of different sizes. Minnesota Fats and Fast Eddy Felson would have had fits.1
Diffusion is supposed to be easy because all you need to know is one equation—Fick’s Law—and you are done. Ha. Trouble is that the equation is only an approximation, and we can’t really measure the material properties to make the equation work anyway because the properties change with both temperature and vapor pressure. And there are many different materials. Too bad for us that there are temperature differences and vapor pressure differences across assemblies. Too bad for us that there are many materials making up assemblies. Too bad for us that everything varies all over the place all of the time.2
And what we call diffusion isn’t diffusion anyway; it’s a combination of diffusion, capillarity and surface diffusion with simultaneous flows of varying magnitudes sometimes in opposite directions. And the physics is not clear or agreed upon or understood. Consensus? For that you have to go to the IPC.3 You won’t find it here. But in the end, it doesn’t matter to me because I’m an engineer, and I don’t need to know all of this as long as I know what happens in the end.
Here it is. Ready for the answer? All the action happens at the surface.4 That’s it. That’s the magic insight. That’s what you gotta know. A blind man could see it. OK, maybe not. Work with me on this. Ever wonder why dew point calculations never make sense? Think about it. They say that condensation happens in the middle of wall cavity insulation. Ever see any there? Huh, huh? Never. So dew point calculations are a lie? Not really, but folks tend to get the wrong impression with them. It turns out that context is everything. For starters, ASHRAE Handbook—Fundamentals has the dew point calculation thing right, but no one follows the actual ASHRAE procedure. And certainly no one pays attention to the assumptions and limitations for that calculation. Ah, that assumption and limitation thing again. For yuks, you ought to go read Fundamentals.
I remember a great little experiment done for the benefit of us newbies in 1982 at my alma mater, the University of Toronto, by Professor John Timusk (a.k.a. “JT” by his grad students). A wood frame wall with fiberboard on one side, fiberglass insulation in the cavities and nothing on the other side was put into a climate chamber. One side was maintained at 0°F (-18°C) and the other 70°F (21°C) at 50% RH. Quick, what’s the dew point temperature of 70°F air (21°C) at 50% RH? Where is my psychrometric chart? That would be around 50°F (10°C).
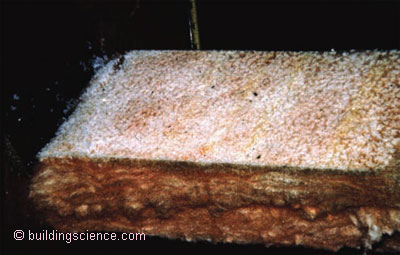
Where does that fall in the wall? About a quarter of the way in the wall if you believe Figure 1? Check out Photograph 1. Where is all the frost? It’s on the backside of the sheathing.
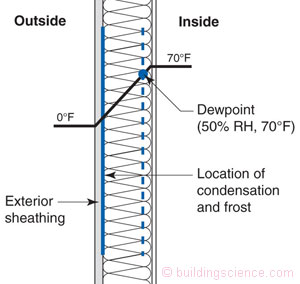
Figure 1: Dew Point Location—The frost and condensation end up on the backside of the sheathing, not at the dew point location.
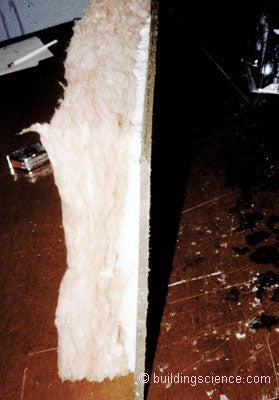
Photograph 1: Surfaces are Where the Action Is—The frost has accumulated at the backside of the sheathing, not in the middle of the cavity insulation.
So why doesn’t the water condense at the dew point location in the fiberglass batt? Well, it actually does; it just doesn’t stay around very long. It moves on to a colder and colder spot until it can’t go any farther easily. The molecular water billiard balls keep beboping along until they get to an interesting spot on the table where the rules change. This cold spot where stuff begins to accumulate is usually a spot of interest to engineers. Some folks call this a “preferential nucleation site” even though nucleation is happening all over the place near and around the dew point location. Whatever. Other folks call this the “first condensing surface” even though it is not really the first condensing surface of interest to most normal people. Normal being very subjective at this juncture in this discussion.
The “condensing surface of interest” in most wall assemblies is the backside of the sheathing because that’s where the water is.5 A way of thinking of this is that if you know the surface conditions of the backside of the sheathing you pretty much can predict what is going to happen in the wall. Another way of thinking of the backside of the sheathing is that it is a “dehumidifier” for the wall cavity. Its temperature establishes the vapor pressure in the wall cavity when you have porous vapor open cavity insulation like fiberglass and cellulose since these insulations have vapor resistance close to that of “free air.”
Taking this a little further, the “condensing surface of interest” in a room is typically the interior surface of a window (Photograph 2). The window temperature controls pretty much what happens in the room. In the old days with single pane glass windows it established the maximum vapor pressure in the room since the window was the defacto room dehumidifier. That’s why in the old days we would blow warm air against the inside of the window to warm it up to control condensation.
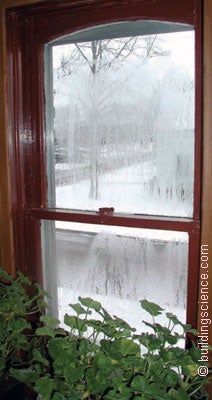
Photograph 2: Window Dehumidifier—Interior surface of the window in a room pretty much controls what happens in the room.
And further still the “condensing surface of interest” in a roof assembly is typically the underside of the attic roof sheathing (Photograph 3) not the middle of the roof insulation (Figure 2). Actually, the nails see the condensation first, then the sheathing. Photograph 4 is what happens when someone has too much time on their hands.
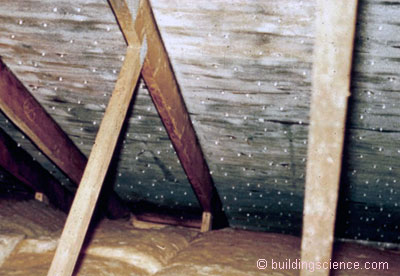
Photograph 3: Roof Sheathing—Nails frost up first, then the underside of the roof sheathing.
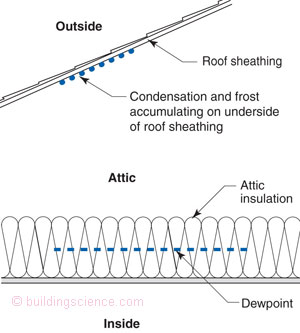
Figure 2: Attic Sheathing—Underside of the attic roof sheathing is where the action is, not at the dew point location in the ceiling insulation.
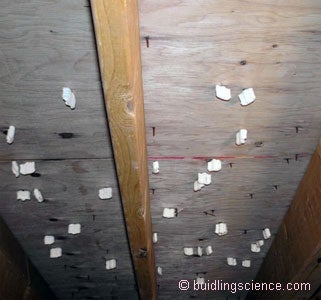
Photograph 4: Condensation Control—Yes, it is true, there are crazy people around. An attempt to warm nails by insulating them.
How about vented crawlspaces? Ah, we typically have two “condensing surfaces of interest”: the underside of the cavity insulation in the floor joists (Photograph 5) and the top surface of the ground cover (Photograph 6). What is going on is that the outside air dew point temperature is above the ground surface temperature for several months of the year. The ground surface temperature governs what happens in the crawlspace because it pretty much determines what the temperature of the underside of the insulated floor assembly is. The underside of the insulated floor assembly is within one or two degrees of the ground surface temperature because the two surfaces are radiation coupled (Figure 3). So, how do you figure out the ground surface temperature in a crawlspace? Easy. A reasonable rule-of-thumb to estimate crawlspace ground surface temperatures is to use the average annual ambient air temperature for that location.
Photograph 5: Crawlspace Condensation—Water droplet forest on underside of crawlspace sublfoor cavity insulation.

Photograph 6: More Crawlspace Condensation—How did the water get on the top of the plastic ground cover? It condensed out of the ventilation air.
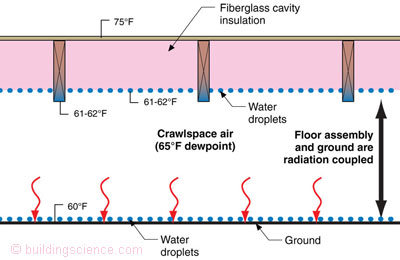
Figure 3: Vented Crawlspace—Moisture accumulates on the underside of the fluffy stuff and on the top side of the plastic ground cover because both of those surfaces are below the dew point temperature of the air in the crawlspace, which is really outside air because that is where it came from.

Figure 4: Crawlspace Analysis of Condensation Potential —This is adapted from Handegord and is pretty easy, which is what analysis should be all about. This is a plot of the average outside dew point temperature of the location over the course of a year versus the ground surface temperature in the crawlspace. The shaded area means bad things are happening.
You actually could do a simple analysis to determine risk. Plot the average outside dew point temperature of the location over the course of a year versus the ground surface temperature in the crawlspace. The temperature of the ground surface in the crawlspace we already know to be pretty much the average annual ambient air temperature for that location (Figure 4). I picked Richmond, Va., for the example. Pick one for yourself and do the same thing. Pretty risky in most locations, eh? Notice, there was no real calculation involved, just plotting some temperatures and using some judgment.
How do you handle crawlspaces then? Ah, go back to a previous Insight (BSI-009: New Light in Crawlspaces).
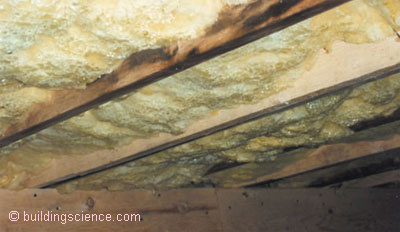
Let’s go back to attics and check out Photograph 7, which is a picture of the top of a thick fiberglass batt from a vented attic. Notice the frost on the top of the batt? Where the heck did that come from? Shouldn’t the frost be on the underside of the roof sheathing? Actually, in this case, it is there as well. This little twist to the reality show we call life comes courtesy of night sky radiation. The roof deck is colder than the outside air dew point and is radiation coupled to the top side of the attic insulation.
Photograph 7: Radiation Coupling in Attic—Frost on the top surface of attic ceiling insulation.
When the attic is vented and the ventilation air enters the attic it “sees” the two coldest surfaces in the space—the underside of the roof deck and the top of the insulation (Figure 5). Meteorologists tell us that water requires a nongaseous surface to make the transition from a vapor to a liquid. Not a lot of them in the air in an attic. The attic surfaces are where the action is. Notice the keyword “surfaces” again.
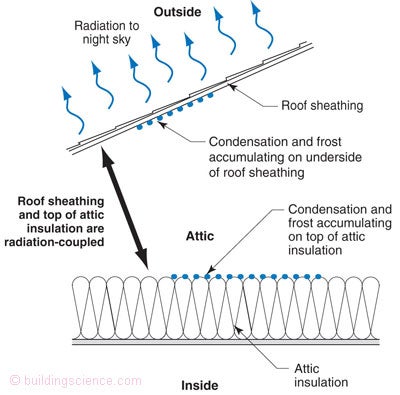
Figure 5: Night Sky Radiation and Vented Attics—This is pretty neat. The roof deck is a couple of degrees colder than the outside air temperature due to night sky radiation. This also drops the temperature due to night sky radiation. This also drops the temperature of the top surface of the attic insulation. The outside dew point is very close to the outside air temperature during the winter. When exterior air is brought into a well-insulated attic assembly, the dew point of this air is sometimes above the surface temperature of the underside of the roof deck and the top surface of the attic insulation.
Let’s go back to walls. Could we do a simple analysis to determine risk of condensation? Something better than a dew point calculation and much less complicated than calling up the Greek Geek and the Kaiser? And probably better? Yes, we could do something handed down to us from a legend.6
Remember the crawlspace analysis done earlier? Do the same thing for walls. In fact, folks were doing this for walls before we even thought of doing this type of analysis for crawlspaces. Let’s look at Chicago. It’s an interesting place with interesting physics and more interesting politics. Figure 6 is the potential for condensation in a wood frame wall cavity for various interior dew points. Figure 7 is what happens when you elevate the temperature of the condensing surface by using insulating sheathing. Once again, the key thing to keep in mind is that surface thing. And, notice that we are using “average monthly temperatures.” Why average temperatures? Ah, because they seem to work and give you the right answer. How do we know they give the right answer? Easy, the real world tells us that they do. It seems quaint considering what we do today, which is pretty much sit at the computer, but in the old days we would actually go out and look at real walls an measure them in situ. We even did laboratory experiments, and wait for it, built test huts.
But this type of analysis does not use a computer. Yeah, pretty neat eh? It just looks at surfaces and handles the diffusion part and the air part, too. I was never very good at billiards anyway.
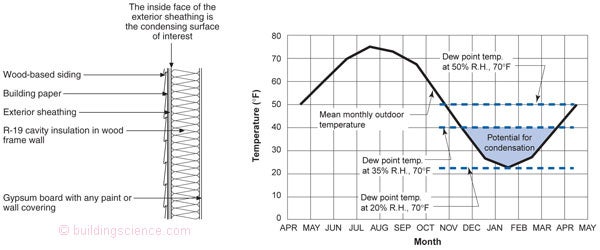
Figure 6: Chicago Wall Analysis—The potential for condensation in a wood frame wall cavity for various interior dew points. Note that when you reduce interior moisture levels the potential for condensation is reduced. This is called a “duh.”
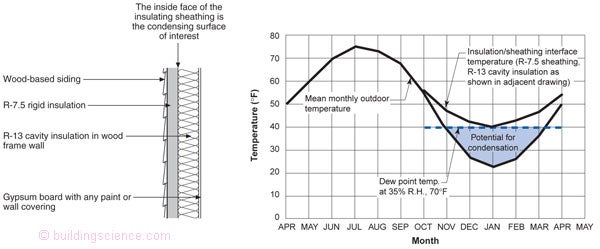
Figure 7: Insulating Sheathing Rocks—The insulating sheathing raises the temperature of the condensing surface of interest. This is a good thing.
Footnotes:
Our generation’s molecular billiard pros are the two Dr. Ks: Achilles Karagiozis and Hartwig Kuenzel—our molecular Minnesota Fats and Fast Eddy—affectionately known as the Greek Geek and the Kaiser. “I’m the best you ever seen, Fats. I’m the best there is. And even if you beat me, I’m still the best.”
You can almost model this. The operative word is “almost.” After all these years, the physics is not really clear, especially where flow regimens change. Modelers have to “make things up” to make it sort of work. The honest ones admit it. And when I say model it, I refer to what most folks call diffusion, which is not really diffusion anyway, see next page. When we add airfow to the mix, the models “blow up” because airfow is so complicated. So we can’t really model anything because we can’t model airfow. So all models are inherently wrong. But, even so, some of them can be useful. Like when I already know the answer, and I can fool the model so that it gives me the right answer. I call this “calibration.” Now the model becomes useful but only within the limits of its assumptions. So, the model accuracy and use is based on the skill of the modeler, and the best modelers already know the answer. The problem is that all modelers think they are skilled and are the best, whereas only a few are. I have found that if the modeler needs the model to get to the right answer the best approach is to doubt the model and get there some other way.
Intergovernmental Panel on Climate Change. It used to be the panel that dealt with global warming but that apparently is not happening anymore. Well, it might be happening but apparently it has to cool a bit first. Or maybe not. It is hard to tell with all the consensus going on. It is soon to be the panel on climate disruption, depending on the outcome of the next election cycle. It is hard to keep up with all the politics, I mean physics. Lucky for us, we can depend on the models and that tree in Siberia with the rings. Or the hockey stick. We do make hockey sticks out of trees in Canada. Makes sense to me that we would get a hockey stick out of a tree in Siberia. Or was it a couple of trees in Siberia? Which trees were they anyway? I forget. I had better go check those e-mails from that place in England where they are setting an example to the rest of us on how to behave in the peer review process.
This is called a “Willy Sutton.” Willy Sutton was a notorious bank robber who was asked why he robbed banks, and he replied “that’s where the money is.” OK, he is credited with the line, but some folks say he never said it—such as Mr. Sutton himself. Apparently, there is not consensus on this either. But he sure did know how to dress.
Handegord, G. O., “Prediction of the moisture performance of walls,” ASHRAE Transactions, Vol. 91,1985. I saw Gus last weekend, and he had a notebook with a list of all the mistakes I have been making in these columns. Sharp as ever. He inspired this column as he has inspired many others. I have been making the corrections on the columns posted on our website: buildingscience.com. Thanks Gus.