This Measure Guideline describes how to model and interpret results of models for above grade walls. It analyzes the failure thresholds and criteria for above grade walls. A library of above-grade walls with historically successful performance was used to calibrate WUFI (Wärme und Feuchte instationär) software models. The information is generalized for application to a broad population of houses within the limits of existing experience.
1 Introduction
Background
Hygrothermal simulations such as WUFI (Künzel 2002) are coming into increasingly common use among building science researchers and practitioners, architects and designers, and energy analysts. Such simulations have been shown to be powerful and validated tools that predict hygrothermal behavior of enclosure assemblies. Simulation developers have continued to expand the capabilities of such tools over time.
However, with increasing dissemination of these modeling tools – most notably WUFI - less- experienced or less-informed practitioners have run models that provide unrealistic results— typically overly conservative. In some cases, these results clearly contradict extensive field experience and known history of assemblies, showing failure when they do not occur in reality. In other more worrisome cases, models run on assemblies that clearly have not performed historically show successful performance. This has resulted in confusion in the building industry—specifically, problems with advancing knowledge of moisture-safe building enclosure/shell assemblies. Development of moisture-safe enclosure assemblies is a component that will contribute to the Building America target of reducing residential carbon emissions 20% by 2020 and 80% by 2050.
NREL and the Standing Technical Committee on Enclosures presented top priorities for research in their document, “Building America Technical Innovations Leading to 50% Savings – A Critical Path” (NREL 2013). Critical Milestone E4, under Enclosures states:
Develop guidance on design methods for enclosure design with a focus on above- grade walls; guidance to be provided for both new construction and retrofits in all U.S. climate zones.
The Technical Report addresses this priority by modeling typical wall assemblies that have performed well historically, and demonstrating that these models agree with historic experience when modeled correctly. A library of input data and results are provided.
Hygrothermal Models
Hygrothermal analysis is a relatively new field. The fundamentals date back to the 1950’s. Analysis was observation and experience based. The major focus was rain and groundwater control. As insulation was introduced into assemblies, energy flows were altered, resulting in materials remaining wetter for longer periods of time. Simultaneously, new building materials were introduced that were inherently more water sensitive. The focus shifted from rain and groundwater to vapor movement in the form of air transport and molecular diffusion. Calculation methods of predicting performance and assessing risk were primitive and typically fundamentally flawed. Analysis remained rooted in observation and experience– i.e., a “build it, wet it, watch what happens” methodology.
In the 1980’s with the advent of numerical analysis and computer availability, it was believed that a shift from observation and experience to numerical methods based on physics was possible. Numerous models were developed but none with reasonable predictive capability. In the 1990’s this changed based on work done in Canada (Kumaran, M., Mitalas, G. and Bomberg, M.; 1994) and Sweden (Viitanen, H., and A. Ritschkoff; 1991). These models were principally research tools rather than design tools. Work done in Germany in 2000 changed the modeling status quo (Künzel, H.; 2002). However, such design models were limited to mass assemblies typical to Europe. North American assemblies are hollow, multi layered, and dominated by three dimensional air flow networks that have proven problematic to modeling efforts.
The dominant European model has proven to be attractive to North American practitioners. WUFI is popular despite its inability to provide reasonable predictive outcomes unless used by an experienced sophisticated user who already “knows” the correct outcome. In fact, despite the sophistication of the numerical analysis, available research is still dominated by experiment. We still must “build it, wet it and watch it.” Then, the observed outcomes are used to “tune” available models. The field remains phenomenologically based, as there is yet no widely accepted theory of combined heat and moisture flow.
2 Moisture Physics Background
State Phases of Water
Water exists in four phases: vapor, liquid, solid, and adsorbate. These phases interact with each other as shown in Figure 1.
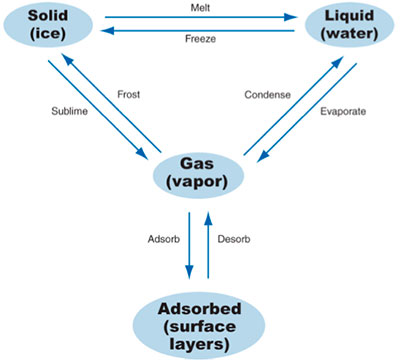
Figure 1: Phases of water (from Kumaran, Mitalis & Bomberg, ASTM MNL 18)
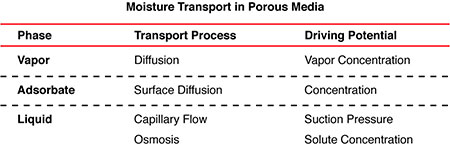
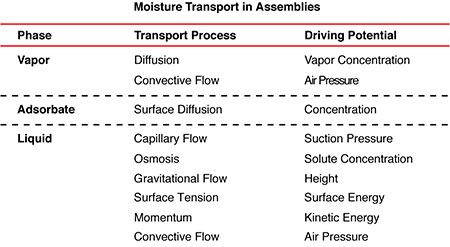
Modeling this interaction in a porous material has proved challenging. Most hygrothermal models simplify the interaction by dropping the interactions with the solid phase. The resultant transport processes and driving potentials are summarized in Table 1.
Table 1
Building Enclosure Materials and Layers
Addressing the dynamic interactions in a single material is complex, and is phenomenologically based, as there is yet no widely accepted theory of combined heat and moisture flow. Addressing the dynamic interactions in a single material is challenging on its own (Figure 2) but addressing the dynamic interactions in several materials simultaneously has proved to be an order of magnitude more difficult (Figure 3). Where the materials are in contact with each other, one-dimensional combined heat and moisture flow models provide reasonable correlation with real world examples and measurements. However, the real world is three-dimensional, whereas the models are one-dimensional. Where the materials are not in direct contact with each other (Figure 4) one-dimensional models tend to break down as they are ill-equipped to handle airflow and the resultant convective flow.
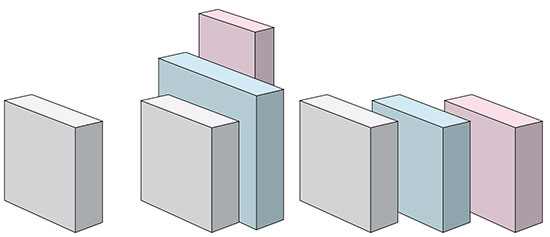
Figure 2: Single material (above left); Figure 3: Several materials in contact (above middle); Figure 4: Several materials not in contact (air gap) (above right)
Rain and Airflow
European building assemblies historically tend to be solid mass systems with little or no convective air flow. In these cases, one-dimensional combined heat and moisture flow models have proven useful in analyzing performance and predicting performance. North American building assemblies, however, are multi-layer systems with complex three-dimensional airflow pathways. One-dimensional combined heat and moisture flow models have provided less than ideal results in these types of assemblies, due to the complexity added by the airflow component.
Both European and North America building assemblies are exposed to rain—this of course is obvious. That rain is a significant moisture load is also obvious. As such, this moisture transport mechanism needs to be considered by hygrothermal models for the models to be useful. Modeling the rain transport mechanism—a three dimensional phenomena in a multi-layer system—adds more complexity.
The challenge for a one-dimensional combined heat and moisture flow model is addressing the rain and airflow component. Figure 5 summarizes the modeling question.
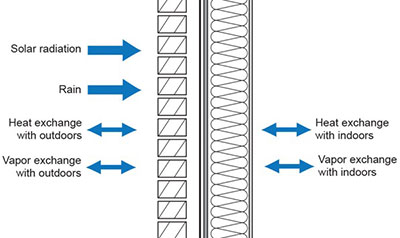
Figure 5: One-dimensional combine heat and moisture flow model
Table 2 summarizes transport processes and driving potentials that need to be addressed.
Table 2
3 Simulation of Rain and Airflow Assembly Interactions
Addressing Rain
The key question is how much rainwater hits the wall, which is a simple question, but not one that is simple to answer. WUFI software adapts the rainwater exposure models developed by Straube and Künzel to determine the amount of rainwater that impinges on the wall.
Some of this rainwater "bounces" (or is shed) off the wall, while some of this rainwater penetrates the cladding, and finally some of this rainwater penetrates the water control layer. This is summarized in Figure 6.
For modeling purposes, we assume that 30 percent of this water "bounces" off the wall, and that 70 percent stays on the wall (adheres to the cladding surface). The 70 percent that stays on the wall ("retained water") is addressed by liquid conductivity (capillary flow) and vapor diffusion.
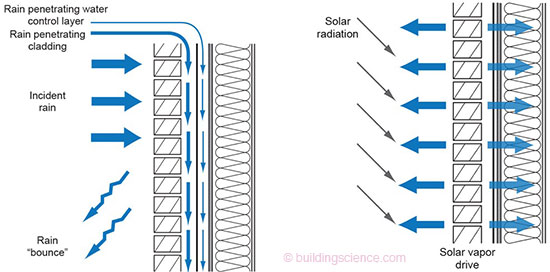
Figure 6: Rainwater penetration in a wall (above left); Figure 7: Solar radiation on a wall (above right)
The amount of solar radiation incident on the wall affects the liquid conductivity and vapor diffusion (Figure 7). As such model orientation can play a significant role.
For modeling purposes, we assume that 1 percent of the 70 percent (the "retained water') penetrates to the back side of the cladding, and we further assume that 1 percent of the 1 percent penetrates/bypasses the water control layer, and enters into the sheathing. The percentages above are based on the experience of the authors.
Addressing Airflow
Another challenge is to model a complex three-dimensional phenomenon in a one-dimensional model. There are twelve (12) typical airflow pathways that need to be considered in multi-layer systems (Figure 8).
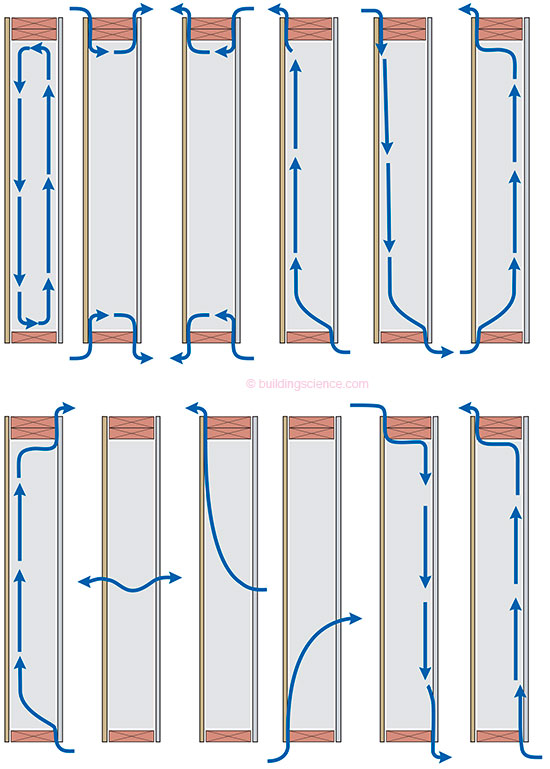
Figure 8: Airflow mechanisms in a wall
These airflow pathways arguably can be combined for modeling purposes as shown in Figure 9. Note the cladding ventilation component that has been added. The flows in Figure 8 can further be simplified as shown in Figure 10. WUFI software is capable of modeling cladding ventilation. Using this capability allows us to approximate the flows in Figure 10, as shown in Figure 11.
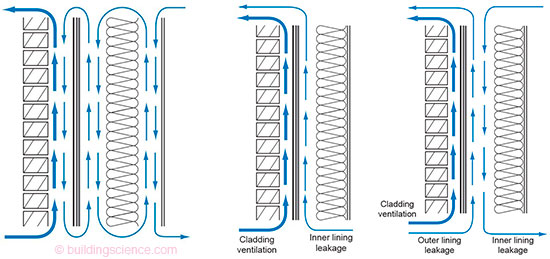
Figure 9: Combined airflow pathways (full level of complexity) (above left); Figure 10: Further simplification of airflow pathways (above middle); Figure 11: Approximation of flows (for purposes of modeling) (above right)
WUFI software is capable of modeling cladding ventilation, by introducing exterior condition air into an airspace within the assembly. This allows for explicit (and correct) modeling of ventilated rainscreen behaviors, including vinyl siding (bypass of vapor-impermeable vinyl material with airflow) or brick veneer construction.
This airflow model within WUFI also allows the analysis of "through the assembly airflow" (i.e., air leakage through typical imperfect assemblies). This flow can be approximated as follows. Two arbitrary 5 mm (3/16 in.) airspaces are created at the interface of the cavity insulation and the structural sheathing. One airspace is coupled to the interior, simulating moves air- transported moisture from the interior to the interior face of the exterior sheathing. The other airspace is coupled to the exterior, and simulates air leakage from the exterior into the cavity. Multiple layers can be addressed in a similar fashion (Figure 12).
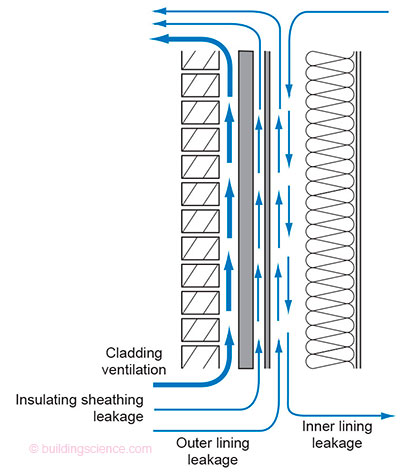
Figure 12: Air space coupling to address through the assembly airflow in WUFI
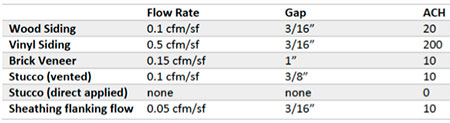
For modeling purposes, we assume the flow rates, gap sizes and air changes per hour (ACH) as shown in Table 3. The information in Table 3 comes from a combination of published work and unpublished work by the authors.
Table 3: Cladding ventilation/sheathing ventilation
4 Material Properties
As discussed in the Building America Expert Meeting on hygrothermal modeling (Ueno and Lstiburek 2014), material properties can have a substantial effect on modeling results. Therefore, guidance is provided below for the inclusion of common materials used in North American walls.
Structural Sheathing (Moisture Content Measurements)
A common practice is to plot the moisture content (MC) of the entire sheathing layer; however, this value is simply the average MC of the sheathing thickness. In reality, sheathing failures are typically associated with high MCs on one face or another—for instance, the interior sheathing face for interior-sourced interstitial condensation, or the exterior face for rain leakage.
Therefore, the sheathing should be divided into three layers: an outer layer, a core layer and an inner layer. For instance, the innermost layer is shown in red in Figure 13, which would be used to evaluate interior-sourced condensation.
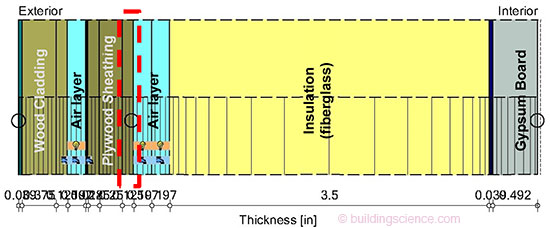
Figure 13: WUFI wall cross-section highlighting sheathing MC interior layer
For typical ½ in. (12 mm) sheathing, these layers should be roughly 1/8 in., 1/4 in., and 1/8 in. (3 mm/6 mm/3 mm). When running a WUFI simulation, the sheathing layer can be entered into the model, and then duplicated to ensure identical material properties.
Oriented Strand Board (OSB)
Unfortunately, OSB has substantial variation in material properties, based on manufacturing processes. However, designers seldom have knowledge of the specific brand/type of OSB sheathing that will be used. Therefore, the best recommendation we can provide is to use OSB with a selected density of 36 pounds/cubic foot (PCF). The vapor permeance should be roughly 0.2 perms dry cup, 3.0 perms wet cup, and 6.0 perms at 100% RH.
Fiberglass Insulation
Most fiberglass insulation used in North America is low density, so the values in WUFI must be modified from their default values. For a 2x6 wall, the insulation thickness should be set to 5.5 inches. Then, entering the layer material properties, “unlock properties” should be selected, and the density changed from 1.87 to 1.2 PCF. This also changes the heat capacity of the insulation.
Note that European R-values values are given at 50° F (10° C), while North American values are given at 75° F average temperature.
Stucco
When modeling stucco, note that stucco is typically painted. The paint layer needs to be defined and implemented in the model. Use the generic material characteristics for polyethylene, and modify the layer by assuming a vapor permeance similar to Kraft paper. Use the permeance for Kraft paper as defined by NIST.
The stucco data for new buildings should use regular Portland cement-based stucco, rather than lime based stucco. Lime-based stucco stores more water, the liquid transport is much greater, and the vapor permeability is double that of Portland cement-based stucco. The WUFI default thickness needs to be changed to 0.75 in.
When installing stucco over a drainage mat, the generic materials table should be used. Use an air layer of 3/8 in. (10 mm), “without additional moisture capacity.” The original WUFI software implemented air spaces using a fictional moisture storage capacity, in order to improve the stability of the software. This fictional layer avoided crashes when using slow processors and memory limitation in the past. This legacy material has not been deleted, but should not be used in modern simulations.
Gypsum Board
The material to select for interior gypsum board is “Gypsum Board USA.” The material “interior gypsum board,” which has a higher density (50 PCF vs. 40 PCF) should be selected.
Interior Paint
For interior paint on interior gypsum board, it should not be modeled as a separate layer. Instead, it as a surface transfer coefficient of 10 perms (a conservative value for latex paint). We recommend against using the curve of latex as a database material, as it is not very sensitive at the interior.
5 ASHRAE Standard 160 Limitations and Viitanen Mold Index
Interpreting the results of modeling has been problematic. For example, wall assemblies that have performed well historically in various climate zones “fail” when standardized moisture failure criteria such as that presented in ASHRAE Standard 160 are applied.
This section covers preliminary research conducted by Glass et al. (2015) on the limitations of the moisture failure criteria presented in ASHRAE Standard 160. This work was summarized in the press by Holladay (2015).
Standard 160 Background
ASHRAE Standard 160 (ASHRAE 2009) provides guidance on moisture analysis for building envelope design, including the moisture performance evaluation criteria. The failure criteria (defined as the risk of mold growth) were redefined in addendum (a) (ASHRAE 2011), as follows:
6.1 Conditions Necessary to Minimize Mold Growth. In order to minimize problems associated with mold growth on the surfaces of components of building envelope assemblies, condition shall be met: a 30-day running average surface RH 80% when the 30-day running average surface temperature is between 5°C (41°F) and 40°C (104°F).
Materials that are naturally resistant to mold or have been chemically treated to resist mold growth may be able to resist higher surface relative humidities and/or to resist for longer periods as specified by the manufacturer. The criteria used in Addendum a to Standard 160-2009 the evaluation shall be stated in the report.
One issue with these criteria is that they are based on IEA Annex 14 (IEA 1991). Annex 14 presented mold risk criteria for interior and exterior surfaces (e.g., mold growth in a cold corner of a room), rather than within a building enclosure assembly (i.e., interstitial mold growth).
Chicago Brick Veneer Wall Simulations
WUFI simulations were used to examine an established wall commonly used in climates such as Chicago, IL (CZ 5A). The wall assembly is a brick veneer with a ventilated cavity (10 air change per hour in a 1 in. airspace), #30 felt, OSB sheathing, 2x4 stud wall with R-13 insulation with Kraft facer (Class II vapor retarder), and interior gypsum board with latex paint. Interior conditions were run at a seasonal sinusoidal cycle (73-75°F, 30-60% RH, winter to summer). Incident rain (1%) was introduced on the #30 felt (water control layer) surface, to simulate water penetration through the brick cladding. Additional rain (0.01% of incident rainfall) was introduced inboard of the #30 felt, to simulate a rain leakage failure past the water control layer.
The resulting temperature and RH conditions at the insulation-sheathing interface (30 day running averages) are shown in Figure 14. The temperature and RH risk ranges discussed above are superimposed on the data, and periods when both risk criteria are met are indicated by a black dot (“Failing Hours”). The analysis demonstrates that this wall assembly—which has a long and established history of acceptable performance in this climate—is at high risk of failure and mold growth, according to ASHRAE Standard 160. This conclusion contradicts common knowledge of local practitioners and builders.
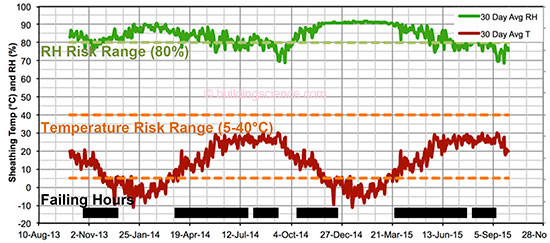
Figure 14: Chicago wall, insulation-sheathing interface conditions and ASHRAE Standard 160 failures
Comparisons with Measured Data (Double Stud Walls CZ 5A) Ueno and Lstiburek (2015) monitored moisture conditions in double stud wood frame walls in CZ5A over three winters. These assemblies included open cell polyurethane spray foam (ocSPF) and dense-pack cellulose insulation, interior vapor control was provided by latex paint on gypsum board.
Instrumentation indicated that the dense-pack cellulose wall showed high risks of moisture damage, with extended winter periods at high sheathing moisture content and RH, as well as possible liquid water condensation. The ocSPF walls also had risks, but less severe. These problems were the worst during the second of three winters, when interior RHs were high (40- 50%), due to inoperative ventilation equipment.
This work was followed by disassembly of the walls, to assess their condition, as shown in Figure 15.
The sheathing, framing, and insulation conditions were surprisingly intact. No signs of moisture damage or mold were visible; there was slight grain raise on the cellulose wall sheathing, as well as some rusted fasteners.
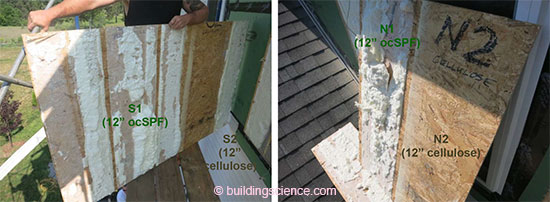
Figure 15: Sheathing conditions at south (left) and north (right)-facing walls
The instrumentation results were then used to perform ASHRAE Standard 160 analysis of conditions at the insulation-sheathing interface. The results for the north-facing walls are plotted in Figure 16: hours that fail ASHRAE Standard 160 are denoted by points; outdoor temperature and the sheathing temperature (30-day rolling average) are plotted for reference.
The results show that all three walls fail ASHRAE Standard 160 requirements during all three winters, and that the cellulose wall (N2) has the worst performance according to these criteria. In addition, winter 2012-2013 (high humidity winter) has more failing hours: the cellulose wall (N2) fails ASHRAE Standard 160 from mid-September through mid-November, and then April through late June. It is interesting to note that failures occur in the walls in fall and spring. During the winters, sheathing temperatures drop below the 41°F/5°C lower limit, even though the RH criterion is exceeded. Overall, based on an ASHRAE Standard 160 analysis, the walls do not dry rapidly enough to avoid problems.
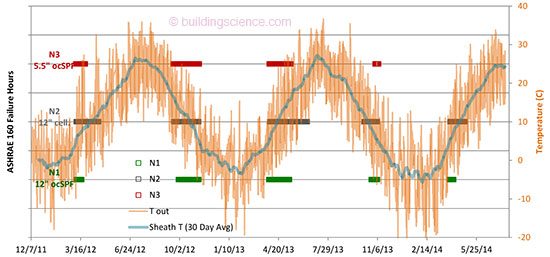
Figure 16: ASHRAE Standard 160 evaluation of north-facing walls, insulation-sheathing interface
Again, this is a clear demonstration that ASHRAE Standard 160 criteria are providing false positives in terms of wall failures, based on monitored assemblies that were visually inspected.
Alternate Mold Growth Criteria (Viitanen Mold Growth Index)
Viitanen and Ojanen (2007) created a mold growth model or index, which instead of a binary pass/fail criteria, has a sliding scale of mold growth to indicate risks. The descriptors of various mold growth levels are shown in Table 4. These mold growth levels vary from 0 (no growth) to 5 (over 50% coverage with visible mold) . . .
Download the complete report here.