Putting metrics on building energy performance is a required step to make any progress on low-energy use and/or “green” buildings. However, there are many confusing and contradictory metrics available; to speak a common language, it is necessary to understand the topics that are behind these measurements. These topics include site vs. source energy, modeled results vs. reality, US average energy use figures, and methods of normalizing energy use. The normalization of energy use intensity (EUI), or dividing by square footage is examined; several significant problems in applying this metric to residential use are demonstrated. Various other metrics are presented, as well as a proposed method to provide all of the useful building energy information in a format that allows normalization by any chosen metric.
Introduction
"If you can not measure it, you can not improve it."
-Lord Kelvin (William Thomson)
Putting a measurement on building energy performance: you would think that it isn’t that hard of a problem, right? Unfortunately, this is a topic that is simultaneously complicated, controversial (at times) … not to mention lethally dull (possibly).
So why do we need building energy metrics? Most everyone in the building profession talks about energy savings, carbon emissions, and “green” buildings—but all of this is just smoke and mirrors until it can be quantified: “Are we saving energy—and if so, how much?” (sadly, sometimes the answer to that question is “No”—see Building Science Insight 007: “Prioritizing Green—It's the Energy Stupid”).
In order to quantify savings, or create targets/goalposts, we need to speak a common language. In other words, when we throw around phrases like, “50% savings,” we need to specify, “Compared to what?” These difficulties are the core of this document; the key topics to understand are:
Site and source energy—the difference between what comes out of the gas pipe, the electric cable, and the power plant. For details, see BSD-151: “Understanding Primary/Source and Site Energy.”
Savings shown by models and simulations vs. savings shown by actual use
Calculations of United States average usage
Normalization methods—unless you have two houses that are identical, with the same number of identical people, and in the same climate, you need to “normalize” to compare House A with House B. But once you start doing that, you start distorting the results—understanding those distortions are vital for looking at the “normalized numbers” with a critical eye.
Organizations such as ASHRAE (American Society of Heating, Refrigerating and Air-Conditioning Engineers), Architecture 2030, and European organizations are promoting building energy rating systems and building energy metrics. They realize that with rising energy prices, a building’s energy bills will be a vital component of its economic viability and its real estate value. Getting those numbers into the public domain (in a transparent form) is a great way to make market forces drive energy efficiency.
Real Buildings vs. Energy Models
When folks are throwing around phrases like, “… this building saves 40% energy relative to a code-compliant house,” these numbers typically come from simulations, or building energy models. They run:
a simulation of the building from the plans and specifications
a simulation of a similar building, but with code-compliant features
and then compare the energy performance (to obtain % improvement)
Examples of this method include the HERS (Home Energy Rating System)/Energy Star scale, ASHRAE 90.1 compliance (used in LEED), California Title 24, and the Building America Benchmark.
So what’s wrong with that?—after all, nobody has the budget to build the two houses and wait for a year of energy bills every time they do a project. This type of energy modeling is the only way to make these predictive comparisons; it is also the way to decide (for instance) “Which makes more sense: adding more photovoltaic panels or adding more roof insulation?”
However, there are some key weaknesses that affect the usefulness of modeled results:
Many times, the model does not—or cannot--capture the complexities and realities of the actual building. This is quite understandable: you need to enter a model in a finite amount of time, and it isn’t known how every single pipe, button, and widget will actually be installed. Also, there are some characteristics that will only be revealed by doing field testing—airtightness, or duct leakage. These things can unfortunately have huge effects—which means you can only realistically predict a limited amount of information with a model, regardless of its sophistication and complexity.
Even more importantly, the effect of the occupant of a building can be tremendous—i.e., “how the building is driven.” There are many studies that look at identical units, and the actual usage shows a factor of three (or more) between the high and low users. To take the driving analogy further: imagine that a Toyota Prius (50 mpg 2010 rating) regularly got mileage between 75 to 25 mpg, depending on how you drove it. It might be obvious, but this type of variability limits how well you can predict things with energy models.
Figure 1 shows an example of the variability is seen in real houses: it plots the annual electric usage of 17 identical houses in Oklahoma, all by the same builder from the same time period. It plots simulation values against actual values—perfect correspondence would be on the diagonal line. Instead, we saw a range from 50% of the prediction to 180% of the prediction.
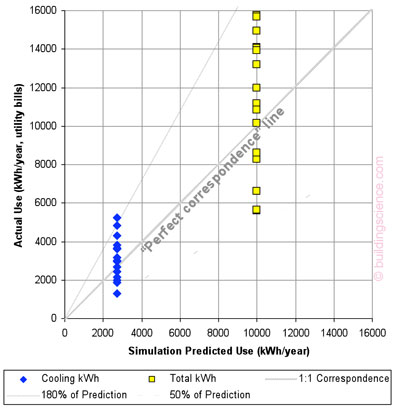
Figure 1: Simulation (horizontal) vs. actual (vertical) electric use for 17 identical houses in Oklahoma
These problems start to explain how you end up with disappointing situations where the building on paper (i.e., simulation) was “rated better than the standard,” while it only achieved middling performance when the energy use was actually measured (see BSI-007: “Prioritizing Green—It's the Energy Stupid”).
The difference between a simulation and energy bills is sometimes called an “Asset rating vs. Operational rating.” This is the language used by ASHRAE’s Building Energy Labelling effort (the “Building Energy Quotient Program”—see Figure 2)—a push to provide energy labels for commercial buildings, so that the market begins to understand (and value) energy efficiency in the commercial properties that they might buy or rent.
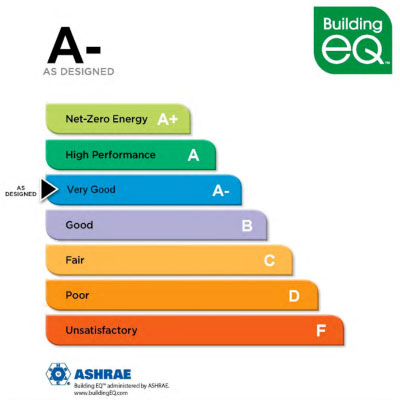
Figure 2: Energy Certificate Examples (ASHRAE 2008)
United States EIA Household Averages: Grading on a Curve
If using an energy model has so many problems, what standard can be used for comparison, once we have the energy bills? Much like an exam being graded on a curve, you want to compare to what the average is for a similar population. If your project is much worse than everything else out there—when you look at the energy bills—you know that you’re doing something wrong.
On the residential side, one commonly cited figure is the energy use per household: the US average is 92 million Btu/year. Note that this is stated in terms of site energy. This (and the following calculations) comes from the Department of Energy/Energy Information Administration’s (DOE/EIA) Annual Energy Review. Digging a little deeper, you can also find the averages broken down by census region, as shown on the map below (Figure 3), which shows usage million Btu/year per household, and how it compares with the US average (±%).
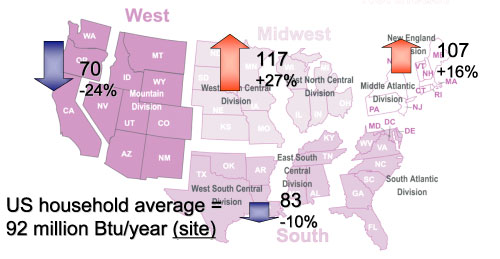
Figure 3: Site Energy: regional per household energy use (million Btu/year)
Clearly, the Northeast and Midwest have a higher per household site energy use, due to their higher heating loads. In addition, the West has lower site energy use—it has a milder climate, overall, than the other regions (especially when weighted by population location).
However, site energy does not give a full or accurate picture, as discussed in BSD-151: “Understanding Primary/Source and Site Energy.” EIA data were combined with site-source conversions, and estimates of per-household source energy use are shown in the Figure 4:
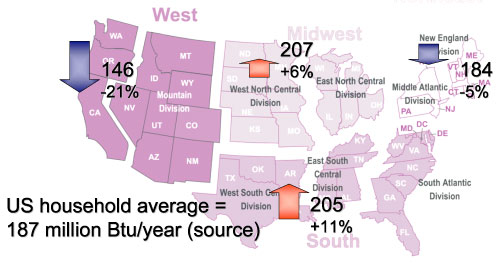
Figure 4: Source Energy: regional per household energy use (million Btu/year)
One surprise is that the South—because it is cooling-dominated—has a heavy electricity load, which makes a big difference in terms of source energy, pushing it above the average consumption. In contrast, heating-dominated climates such as the Northeast and Midwest don’t have as large of a jump.
The numbers from the previous two figures (site and source per household use) are plotted in the bar graph below.
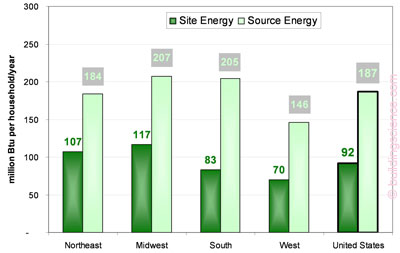
Figure 5: Site and Source Energy per household (million Btu/year): regional and US averages
Energy Use Intensity (EUI): Dividing by Square Footage
One problem with this “per household” average is, of course, that it doesn’t account for house size. More importantly, it doesn’t deal with non-residential buildings at all—what average value is used for a commercial building? Also, what type of commercial building is it?—this makes a big difference for the comparison number. A car dealership? Fast food restaurant? Hotel? Non-refrigerated warehouse?
The way the size problem is addressed is by dividing the energy use by the square footage. This is probably the most common energy metric out there: it is known as “energy use intensity” (EUI). It breaks down energy use (either source or site) by square foot of floor area; the common forms are kBtu/sf·year, and kWh/m2·year. It is used, for instance, by Architecture 2030’s 2030 Challenge, and the Passive House program, when they are defining their targets.
The 2030 Challenge also deals with the “usage type” question very well—they provide EUI targets for a wide variety of types of buildings. Similarly, the EPA ENERGY STAR Portfolio Manager (also online) compares an entered building with a database of similar buildings (based on usage type). That database is the Commercial Building Energy Consumption Survey (CBECS) (also from the EIA), which includes building characteristics and energy use from thousands of buildings across the United States.
Calculating EUI from energy bills and comparing it to values for similar buildings is a very useful comparison, because it looks at real numbers, as opposed to models vs. models, or models vs. reality.
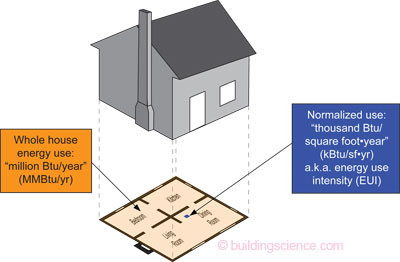
Figure 6: Household energy use vs. EUI (million Btu/year vs. kBtu/sf·year)
Figure 7 graphs site and source EUIs for single family houses, from Architecture 2030 data. It is broken down by Census Region, and includes the US average.
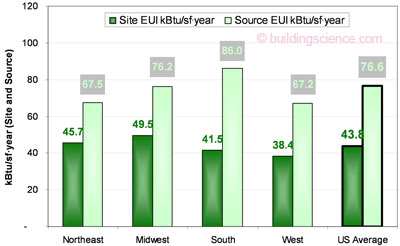
Figure 7: Site and Source Energy Use Intensity (EUI, in kBtu/sf·year): regional and US averages for single family houses. Source: Architecture 2030
Using EUI: A Few Problems
So EUI is the most common metric out there, and it seems to handle many problems very well. You can fine tune it, based on usage type, and climate, if you have a comparison database. But there are definitely some problems with it—we’re getting into those “distortions due to normalization” that were mentioned earlier.
Commercial vs. Residential: Overall, EUI is an excellent metric for commercial buildings—it costs money to build out space, so the square footage tends to get occupied and used, due to economic necessity. So EUI comparisons between similar types of commercial buildings are very reasonable.
However, residential spaces have much more variability of the occupancy of their square footage. For instance, you will see 700 square foot two bedroom apartments, but you will also see 3000 square foot houses with only two bedrooms. This might be an indication that square footage might not map as well to the energy consumption of a given house.
Climate: It is also important to remember that energy use (and thus EUI) will be affected by climate—more so in the residential realm than commercial buildings (residential buildings are “enclosure-dominated”—i.e., total energy use is affected by the weather more than commercial buildings). This can be addressed, for instance, by using regional EUI numbers.
Small House Penalty: Another problem is that EUI—just by how it is calculated—puts smaller houses at a disadvantage. This problem has also been demonstrated for the HERS system (Prahl 2000), and is true for the older version of the Building America Benchmark. Figure 8 shows the results of a set of building energy simulations, comparing household use vs. EUI.
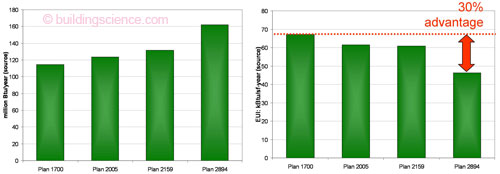
Figure 8: Square footage effects on household consumption (million Btu/year, left), and energy use intensity (kBtu/sf·year, right)
The four houses have square footage ranging from 1700 sf to 2894 sf, and the following characteristics
identical enclosure (shell) insulation values and air leakage rates
identical mechanical systems
similar operating schedules
all modeled in the same climate
Household use increases with house size, as would be expected (left hand graph). But EUI decreases with increasing house size (right hand graph), despite all other characteristics being identical. This is such an effect that the largest house has a 30% EUI advantage over the smallest, despite the houses having the same characteristics.
Another way to look at this problem is that households (regardless of size) have a refrigerator, use hot water, require ventilation, use TVs, etc.—essentially independent of square footage. These energy uses are divided by a small number in a small house, making these homes look like poor performers when they actually might be quite good on a per household basis.
Basement Effects: The previous point shows that the square footage that is used to divide energy use by has a huge effect. This gets into a grey area when you start to deal with houses with basements. The typical decision is to include the basement in the square footage if it is “conditioned”—but the definitions can sometimes be vague. Remember, adding a basement can increase the square footage by third or half again, and substantially drive down the kBtu/sf·year figure. But remember, in reality, a basement can add square footage without much of an energy penalty, because the majority of the surface area is “earth sheltered,” and it regains any losses from mechanical equipment in the basement. As a result, one person has joked that the easiest way to reduce a house’s EUI is to finish the basement, and include it in the square footage.
However, even if a basement is fully finished and used as everyday living space, some argue that the quality of the space is not the same as above grade space, and would apply a reduction factor when including it in square footage calculations.
Due to all of these problems, we would say that using EUI for residential comparisons has some important, perhaps critical, limitations. Note that the Architecture 2030/2030 Challenge has adopted the HERS Index as their target metric instead of EUI: this might be indicative of these problems (Architecture 2030 2008).
Other Normalizations
One normalization adds the effect of climate to EUI, for instance, in the form of kBtu/sf·year·Heating Degree Day (for heating loads). This provides some normalization based on the local climate loading, and/or year-to-year variations in climate. However, this approach assumes that heating loads are the primary energy consumer: in very efficient homes, other energy uses which do not vary with climate (refrigerator, domestic hot water) become a more significant part of the total. Furthermore, this method does not account for cooling loads unless explicitly calculated.
One final metric considered here is to normalize by occupancy (e.g., million Btu/person), instead of square footage. This is based on the belief that the ultimate value of energy use is in services to people. Therefore, energy per person should always be one of the metrics considered, in addition to indicators that divide energy use by building floor area, dollar of GDP, ton of industrial output, etc.
The number of household members would be calculated based on floor plans; a typical method uses the number of bedrooms plus one (#BRs + 1). However, US Census data provides information on the number of bedrooms and the number of occupants; which indicates that only 26% of US households had over 1 person per bedroom. The majority of the surveyed households (73%) have less than 1 occupant per bedroom. Therefore, a more reasonable calculation might be one person per bedroom.
Note that this metric would tend to reward small houses, as opposed to penalizing them.
Finally, all metrics—including this one—can and will be “gamed” by people trying to optimize their rated (rather than actual) performance. Game rooms, studies, and partitioned corners of basement might be relabelled as “bedrooms” to boost performance numbers. This is unfortunate, and perhaps unavoidable; however, given the code requirements for bedrooms (e.g., minimum square footage, and egress window area), this might limit the extent of the “gaming.”
Conclusions
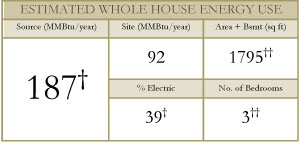
Overall, we are not dogmatically stating that only one building energy performance metric should be used: this document is meant to provide an understanding of the strengths and weaknesses of the options. All of them can be distorted (or “gamed”), but they can also all provide useful information, assuming that the problems are understood. For these reasons, we would recommend the use of the “mileage box” shown below, which presents all the relevant information in one place, thus allowing normalization using any preferred method.
References
American Society of Heating, Refrigerating and Air-Conditioning Engineers, Inc. “ASHRAE Building Energy Labelling Program: Promoting the Value of Energy Efficiency in the Real Estate Market,” June 2008
Architecture 2030/2030 Challenge Target Table. http://www.architecture2030.org/ 2030_challenge/targets.html
Architecture 2030 “The 2030 Challenge Targets Embedded in the HERS Index Architecture 2030 and RESNET Agreement” Press Release, February 14, 2008
Deru, M. and Torcellini P., “Source Energy and Emission Factors for Energy Use in Buildings” Technical Report NREL/TP-550-38617, Revised June 2007
Prahl, Duncan. 2000. “Analysis of Energy Consumption, Rating Score, and House Size.” Washington D.C.: U.S. Green Building Council.
U.S. Department of Energy Energy Information Administration (DOE/EIA). Annual Energy Review 2007, June 23, 2008 DOE/EIA-0384(2007)
U.S. Environmental Protection Agency (EPA). Energy Star Portfolio Manager. http://www.energystar.gov/index.cfm?c=evaluate_performance.bus_portfolio...