This report compares the moisture related performance of an exterior insulated wall to the performance of two other common construction methods, side-by-side. The data presented is a subset of experimental data from a multi-phase, multi-year research project at the Vancouver Field Exposure Test Facility led by Building Science Corporation (BSC) and Gauvin 2000 Construction Limited. The analysis includes results from normal operating conditions in a high stress exterior moisture environment (typical of the Pacific Northwest climate) and under intentional controlled wettings to the interior and exterior of the sheathing. There were no measured or observed moisture related durability concerns of the wood structural sheathing when 1.5” of exterior insulation was installed.
1. Introduction
A multi-phase, multi-year research project at the Vancouver Field Exposure Test Facility near Vancouver, British Columbia project is being led by Building Science Corporation (BSC) and Gauvin 2000 Construction Limited.
A test hut was constructed in the fall of 2005, in Coquitlam, British Columbia that permits the side-by-side construction and comparison of seven 1.0m x 2.4m (38” x 96”) test wall panels on each cardinal orientation (for a total of 28 wall test panels) and three 3.6m x 7.2m (12’ x 24’) roof panels on the north and south facing roof slopes (for a total of 6 roof test panels). All of the test panels are exposed to the same indoor conditions. The objective of the test hut was to determine the performance of historical, current and possible future wall assembly configurations under field conditions. Each wall or roof assembly is instrumented with different types of sensors to collect the desired assembly data (e.g. moisture content, temperature relative humidity, etc.) and is stored on a central data logger. Exterior weather data is also collected with a small meteorological tower mounted on the roof.
The third phase of testing started December 17, 2009 and was completed on November 3, 2011. The primary focus of this phase was to simulate wetting events directly against the exterior surface of the wood sheathing instead of the interior of the enclosure as previously tested, while simulating representative interior wintertime relative humidity levels. These test conditions are described in more detail below.
This report is divided into five main sections
- Section 1 explains the background of the research, the objective of the report, and how the analysis will be conducted
- Section 2 describes the experimental plan including the test facility, monitoring instrumentation and wetting systems.
- Section 3 is the data analysis from the moisture monitoring instrumentation system. The measured sheathing moisture contents are compared following intentional wetting events, and under normal operating conditions. Dew point analysis is always conducted to determine the moisture durability risk to the walls from potential air leakage condensation.
- Section 4 includes the visual observations from the test wall deconstruction conducted in November, 2011
- Section 5 is the conclusions based on the data analysis and observations.
Objective
This report will analyze the performance of a test wall on all four cardinal orientations constructed with 38mm (1.5”) of exterior insulation installed over OSB, in particular, when there is liquid water trapped directly against the sheathing between the sheathing and the exterior XPS insulation. There are reported perceptions that installing low vapor permeance exterior insulation over wood sheathing will result in moisture related durability issues of the wood based structural sheathing. This perception is important to address because installing exterior insulation will become more prevalent with the changing building codes, and requirements for continuous insulation.
The performance results of the exterior insulated wall will be compared to the performance of two other common construction methods, side-by-side. The analysis will include the results from normal operating conditions (i.e. without intentionally adding water) in a high stress moisture environment (on the exterior that is typical of the Pacific Northwest climate), and under intentional controlled wettings to the interior and exterior of the sheathing.
Scope
This analysis will focus on the performance of an exterior insulated wood framed residential wall on all four cardinal orientations. The performance results of the exterior insulated wall will be compared to the performance of two other wall systems. The comparison wall systems are as follows:
- Direct applied stucco with an interior 6 mil polyethylene vapor control layer
- Ventilated stucco with an interior 6 mil polyethylene vapor control layer
This analysis is a small subset of all test hut data. Analyzing all of the test hut data and comparisons in one report would make the report too cumbersome to both write and read. There are further analysis reports expected similar to this one to analyze various performance differences based on other comparison criteria such as vapor control, cladding type, ventilation, sheathing membrane and interior conditions.
Approach
The analysis of these walls will be done by comparing several criteria. These criteria include:
- Sheathing wood moisture content measurements under normal operating conditions
- Sheathing wood moisture content measurements during the wetting and drying from an interior wetting event
- Sheathing wood moisture content measurements during the wetting and drying from an exterior wetting event
- Qualitative visual observations during deconstruction
2. Experimental Plan
The Test Facility
A 957 sq. ft. (29’x33’) field exposure test facility was designed and constructed in the Coquitlam suburb of lower mainland BC.
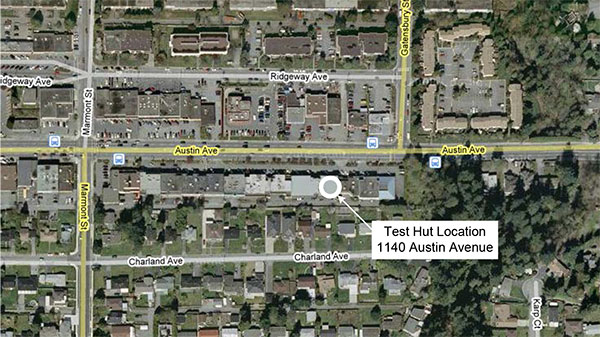
Figure 1: Test hut location in Coquitlam, British Columbia
The facility permits the side-by-side construction and comparison of seven 1.0m x 2.4m (38” x 96”) test wall panels on each cardinal orientation for a total of 28 wall test panels. This building permits all of the test panels to be exposed to the same interior conditions. The test panels were also exposed to the same exterior conditions relative to their orientation (i.e. all North walls can be expected to have the same exterior conditions).
The test facility was constructed on the roof of a low rise office building which is owned by Gauvin 2000 Construction. This location eliminated the need to buy or rent a large empty site (with free wind and solar approach) in the expensive real estate market of greater Vancouver. It also affords the test facility some protection from vandalism.
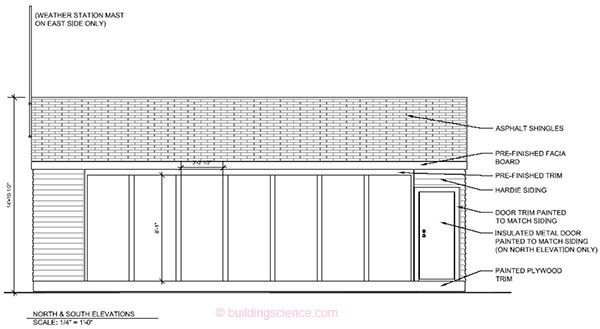
Figure 2: Elevation drawing of Coquitlam test hut
Instrumentation
Each of the test walls was outfitted with a series of temperature, relative humidity (RH) and wood moisture content (MC) sensors. These sensors were continuously monitored and recorded throughout the testing period using a data acquisition system. Variations on a “typical” sensor package (illustrated Figure 5) were used for each test panel. Photographs of the individual sensors are shown below.
Moisture content pins were installed in the framing lumber and the sheathing (from the interior) in all wall systems (Figure 3). Wood moisture contents can be determined from electrical resistance of wood based on the Garrahan equation1, 2. These pins can be used to measure moisture content at any depth chosen because the pins are electrically insulated except for the tips. Measurements are most commonly taken at ¼” (6mm) tip depth. In this study, moisture contents were taken at two depths on the lower OSB near the wetting system. The wood moisture content pins were installed in combination with a temperature sensor in all locations. To correct the moisture content readings for temperature effects, a hole was drilled to the same depth as the moisture content pins and a temperature sensor was installed inside.
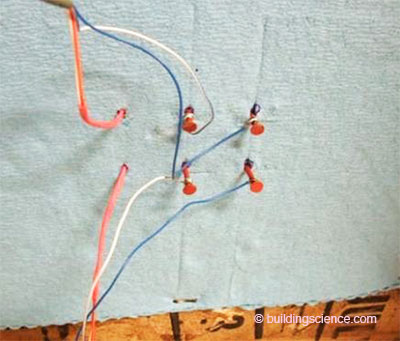
Figure 3: Moisture control pins installed in plywood sheathing through the wetting system
Relative humidity sensors were installed in the middle of each stud cavity, and in the drainage space of each wall. The relative humidity sensor was always installed in combination with a temperature sensor, both of which are protected by a vapor permeable, water resistant cover (see Figure 4). Relative humidity and temperature sensors were installed at the midpoint of the stud space, between the drywall and the sheathing, as well as some drainage cavities.
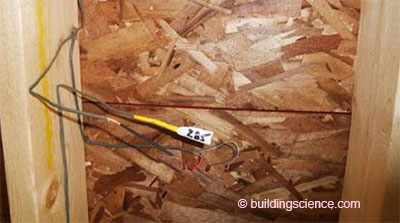
Figure 4: Relative Humidity and temperature sensor installed in a stud bay (with moisture content pins installed below)

Figure 5: Typical wall construction and sensor configuration
One of the most significant advantages to using a test hut for analysis compared to instrumenting walls in existing buildings is that the experimenter can deliberately and easily stress the walls with high moisture loads, either in terms of vapor (eg. >=50% interior RH) or liquid water (e.g. intentional wetting systems) in test huts with removable/replaceable walls. In most cases, building owners are not interested in participating in research conducted on their enclosure walls by adding moisture. In addition, it is often difficult to determine the performance of a wall system without stressing the moisture tolerances of a wall to determine the comparative risk of certain construction techniques.
Enclosure Wetting Systems
A wetting apparatus was installed on both the interior and exterior of each of the test walls to allow a known amount of water to be injected at a controlled time and location. The wetting apparatus consisted of a storage media installed directly against the interior and exterior surface of the sheathing (Figure 6), with a perforated tube connecting each of the storage media to the interior of the test hut for access for water injections. This enables wetting to either the interior or exterior independently without opening and disturbing the wall system. The wetting system is designed to simulate a window leak, and can be used to help determine the drying potential of a wall system. A photograph of an exterior installed wetting apparatus is shown in Figure 6. On the analysis graphs the exterior wetting events are indicated by red vertical dashed lines and the interior wetting events are indicated by blue vertical dashed lines. When an intentional wetting event occurred repeatedly over multiple days, only one line is shown indicating the first wetting. There were five intentional wetting events as shown in Table 1. For each wetting event, 1.5 oz (45 mL) was injected twice a day for five days. This is a total of 15oz (~450mL) into the wetting apparatus directly against the sheathing. For the entire test period 60 oz (~1.8L) was injected against the exterior of the sheathing, and 15oz (~450mL) was injected against the interior surface of the sheathing.
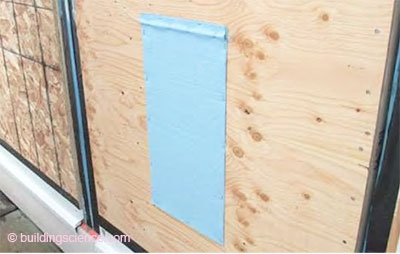
Figure 6: Exterior wetting apparatus . . .
Download complete report here.
Footnotes: