Polyisocyanurate insulation is a common commercial and residential roof and wall insulation. It has one of the highest R-values per inch of thickness among common insulations.
However, labeled R-value differs from in-service R-value for many insulations. Building Science Corporation (BSC), and others have been examining this difference. BSC has found significant thermal performance differences between different manufacturers of insulation products and significant differences based on in-service temperature. The following discussion relates to BSC’s work to date with polyisocyanurate roof insulation.
How are Label R-values Determined?
Most label R-values are based on testing that does not account for real-life temperature conditions and real-life installations.
The R-value Rule
The Federal Trade Commission “R-value Rule” requires that
“manufacturers and others who sell home insulation determine and disclose each product’s R-value and related information (e.g., thickness, coverage area per package) on package labels and manufacturers’ fact sheets.” 1
The R-value Rule requires that all types of insulation (except aluminum foil) be tested in accordance with one of four standard test methods defined by ASTM, the American Society of Testing and Materials.2
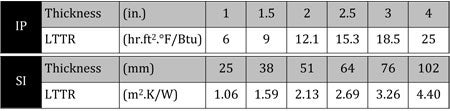
Table 1: Four Polyisocyanurate Manufacturers ALL report the same Label R-values

The Rule requires that R-value tests be conducted at a mean temperature of 75°F (23.9°C) and a temperature differential of 50°F (27.8°C). This means that insulation is usually tested with the cold side at 50°F (10°C) and the warm side at 100°F (37.8°C).3
The R-value Rule only applies to insulation products that are marketed and sold to residential consumers; however it has a strong influence over labeling practices for a wide range of insulation products in the commercial, institutional and residential building industry.
Aged R-values
The R-value Rule recognizes that the thermal performance of some insulation materials changes as they age (e.g. many, but not all, foam insulations) or settle (e.g. some loose-fill insulations). The R-value of polyisocyanurate decreases as some of the gasses in the pores from the manufacturing process diffuse out and are replaced with air. The “gas replacement” process is very slow and takes years to complete (depending on material, assembly and exposure conditions), so samples must be artificially aged before R-value testing if one wishes to predict long-term thermal performance. Several aging methods have been debated over the past decade but most polyisocyanurate manufacturers are currently using one method: Long Term Thermal Resistance (LTTR).4
Published Polyisocyanurate R-values
Table 1 shows the published (i.e. label) R-values for various common thicknesses of polyisocyanurate insulation. The table is based on literature for polyisocyanurate insulation products produced by four large national manufacturers.5
The four manufacturers make a wider variety of board thicknesses than shown in this table; however, all four manufacturers produce boards at these thicknesses and all four reported the same LTTR for each thickness shown.
Not all industry stakeholders are in agreement with the R-6/in. LTTR value published by polyisocyanurate insulation manufacturers for 1 and 1.5 inch thick samples. Since 1987 the National Roofing Contractor’s Association (NRCA) has recommended designers use R-5.6/in. as a reasonable estimate of the actual thermal performance of polyisocyanurate insulation over the lifespan of a roof assembly.6
Factors Affecting In-Service Thermal Performance
The R-value Rule isn’t designed to account for all factors that affect the in-service performance of an insulation product. Rather, it was developed to simplify the many technical issues (e.g. material type, density, thickness, settling, aging) that affect thermal performance so residential consumers can make informed decisions.
The Rule accounts for some properties that can be controlled at the time of manufacture such as material type, and some properties that change over time regardless of application such as settling and gas replacement; however, the Rule does not account for other, application specific, factors that affect in-service performance such as moisture content and temperature.
Temperature Dependency of R-values
Some insulation materials exhibit better thermal performance as temperatures get colder (i.e. the apparent R-value increases as the temperature decreases) and some materials exhibit worse thermal performance as temperature gets colder (i.e., the apparent R-value decreases as the temperature decreases). The latter is the case with polyisocyanurate products. Material properties vary from manufacturer to manufacturer.
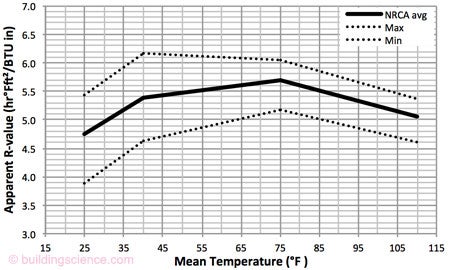
 Figure 1: Range of per inch R-values for NRCA test on 15 polyisocyanurate samples
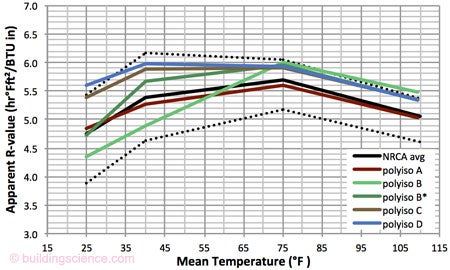
 Figure 2: BSC and NCRA average mean temperature R-value test results for 2 in. samples
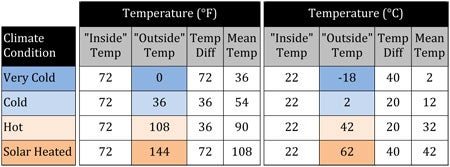
Table 2: Test temperatures to represent various climate conditions

NRCA Mean Temperature R-value Testing
NRCA identified the temperature dependency of polyisocyanurate R-values.7 The investigator, Mark Graham, reported on results from R-value testing of fifteen 2 in. (51 mm) thick samples collected from across the United States. The tests were performed on “as received” material (i.e. the material was not aged prior to testing – new samples are usually expected to have higher R-values than aged samples) in accordance with ASTM C-518, at mean temperatures of 25, 40, 75 & 110°F (-3.9, 4.4, 23.9 & 43.3°C), and at a temperature difference of 50°F (27.8°C).
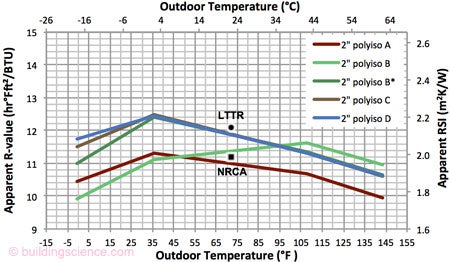
 Figure 3: Service temperature R-value test results for nominal R-12.1 (LTTR) / R-11.2 (NRCA) insulation
Graham plotted per inch R-value versus mean temperature (reproduced as the solid black line of Figure 1). The reported values were the average of the results from the fifteen test samples. Graham did not report the range of test results in that article; however, he did report them in a subsequent publication . The dotted black lines of Figure 1 indicate the upper and lower bounds (i.e. the max and min) for NRCA’s set of fifteen samples.8
BSC Mean Temperature R-value Testing
BSC recently completed similar tests on sixteen 2 in. (51 mm) thick polyisocyanurate insulation samples from four manufacturers and five manufacturing facilities.9 Figure 2 presents a comparison of the per inch R-values from the BSC and NRCA tests on 2 in. (51 mm) thick polyiso samples. The BSC test results agree well with the NRCA test results.
The BSC and NRCA test results both suggest that the thermal performance of polyisocyanurate decreases as the mean temperatures deviate from of 75°F (23.9°C), the mean temperature used for label R-value tests.
Temperature Dependency of In-Service Thermal Performance
Testing shows that R-value appears to decrease as temperatures get lower. The relationship between temperature and R-value appears to be non-linear (i.e. it’s not a simple straight line) so the mean temperature R-value tests cannot easily be used to predict in-service performance.
Additional “Service Temperature” R-value tests were conducted at temperatures (shown in Table 2) selected to represent a range of climate conditions (i.e. inside and outside temperatures) that are likely to occur throughout North America.
BSC Service Temperature R-value Testing: 2 in. Polyisocyanurate Samples
Figure 3 shows the results of service temperature R-value tests conducted on the same sixteen samples of polyisocyanurate. All four polyisocyanurate manufacturers report an LTTR of R-12.1 (RSI-2.13) for a single, 2 in. (51 mm) thick piece of the tested polyisocyanurate insulation products. If the NRCA recommendation of R-5.6 /
in. is assumed, the 2 in. thick polyiso would be R-11.2 (RSI-1.97). For reference, these two points are marked on the graph at an outdoor temperature of 72°F or 22°C (i.e. a temperature at which the R-value doesn’t really matter).
All of the samples show a decrease in R-value as “outside” temperatures go below freezing.10 It appears that the “peak” R-value for all samples occurs when outdoor temperatures are closer to the indoor temperature (i.e. between 36°F or 2.2°C and 108°F or 42.2°C). Winter temperatures (i.e. less than 32°F or 0°C) and solar heated roof temperatures (i.e. greater than 113°F or 45°C) result in lower R-values.
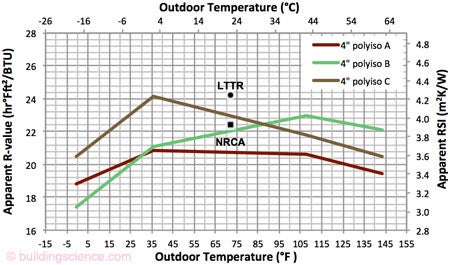
 Figure 4: Service temperature R-value test results for nominal R-24.2 (LTTR) / R-22.4 (NCRS) insulation
BSC Service Temperature R-value Testing: 4 in. Polyisocyanurate Samples
Further service temperature R-value tests were conducted on three pairs of the original samples. The samples were stacked (i.e. double 2 in. samples) in pairs to permit the testing of 4 in. of polyisocyanurate insulation. The manufacturers of the products all reported an LTTR of R-25 (RSI-2.13) for a single, 4 in. (102 mm) thick piece of polyisocyanurate insulation; however, BSC tested a double 2 in. (51 mm) layer so the appropriate LTTR is 2 x 12.1 = R-24.2 (RSI-4.26). If the NRCA recommendation of R-5.6 / in. is assumed, 4 in. of polyisocyanurate will be R-22.4 (RSI-3.95), regardless of how many layers are used.
Figure 4 shows the results of the service temperature R-value testing on the double 2 in. polyisocyanurate samples. Again, all of the polyisocyanurate samples exhibit a significant decrease in thermal performance when the outdoor temperature is colder.
Implications
For cold service temperatures the following recommendations are offered:
- Use thicker layers of polyisocyanurate insulation to ensure that the performance meets expectations. NRCA’s most recent recommendations are to assume that polyisocyanurate has R-5.6 / in. when designing for warm climates and R-5.0 / in. when designing for cold climates.11
- Use a hybrid insulation approach – install cold temperature-tolerant insulation over top of the polyisocyanurate insulation to increase the mean temperature of the polyisocyanurate. BSC continues research into the temperature dependency of different insulation materials and products. Future publications will address exterior insulating sheathing products for residential and commercial wall systems.
Footnotes:
- Federal Trade Commission 16 CFR Part 460, “Labeling and Advertising of Home Insulation: Trade Regulation Rule; Final Rule”, May 31, 2005.
- See ASTM C 177-04, ASTM C 518-04, ASTM C 1363-97, ASTM C 1114-00.
- The actual language of the Rule permits test temperature differentials of 50°F +/- 10°F for cold side temperatures of 45-55°F and hot side temperatures of 95-105°F.
- ASTM C-1303-11 and CAN/ULC-S770-09.
- Reported R-values from literature for Firestone ISO 95+, Atlas ACFoam-III, JM Enrgy 3 AGF, Carlisle SecurShield.
- Graham, M., “Comparing polyiso R-values”, Professional Roofing, April 2003. More recently NRCA revised this recommendation to R-5.6 / in. for warm climates and R-5.0 / in. for cold climates.
- Graham, M., “R-value concerns”, Professional Roofing, May 2010.
- Data from NRCA presentation “NRCA Technical Program & Issues: Polyisocyanurate Insulation Testing”, International Roofing Expo, Feb 22, 2010.
- Samples from manufacturer “B” were collected from an East coast plant (noted as “polyisocyanurate B) and a West coast plant (noted as “polyisocyanurate B*).
- The decrease in R-value is thought to be a result of condensation of the gasses that are trapped in the cells or pores during manufacture of the foam insulation; if the walls of the cells are coated in a highly conductive condensate (a liquid), heat transfer will increase and the R-value will go down. The mix of pore gasses probably condenses over a range of temperatures with condensation first starting at temperatures above freezing. Further BSC testing seeks to study this phenomenon further and establish a conductivity vs temperature curve for various polyisocyanurate insulation products.
- Graham, M., “Revised R-values”, Professional Roofing, Dec 2010.