The software CONTAM was used to create a calibrated multi-zone model to replicate in-field tracer gas decay measurements of a new two story, 2600 ft2 (240 m2), single-family house in Sacramento, CA under different whole-house dilution ventilation scenarios. The enclosure leakage distribution was adjusted to tune the model to the measured tracer gas concentration data. The calibrated model was then used to compare different ventilation systems under identical outdoor conditions over a one-day period. Results showed that ventilation systems that delivered air to all zones, either by a dedicated duct system or by incorporation of the central forced-air space conditioning system, had more uniform ventilation air distribution.
Introduction
This paper describes the creation of a calibrated computer model for residential ventilation systems and the use of the calibrated model to extend the results obtained in previous field testing. The model calibration process used test data from tracer gas testing of residential ventilation systems in a new single-family house near Sacramento, California. Hendron (2007) detailed the tracer gas testing and conclusions. The work described in this paper was performed in order to evaluate ventilation systems that were not present in the houses tested by Hendron and to provide the capability to extend the results of field testing in one location under one set of environmental conditions to many locations under many sets of environmental conditions.
Description of House
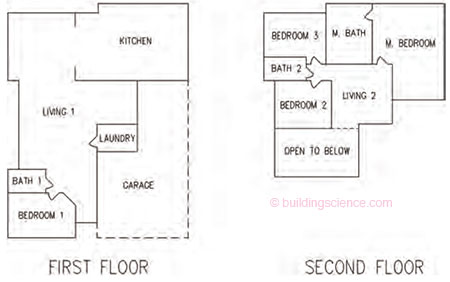
This work concentrates on one of the two houses tested by Hendron (2007). The house is two-story, approximately 2600 ft2 (240 m2), with four bedrooms and three bathrooms. The first floor consists of one bedroom, one bathroom, a laundry room, the living room area, and a kitchen and dining room. The second floor consists of the master bedroom and bathroom, two additional bedrooms, an additional bathroom, and a small common area at the top of the stairway which overlooks the living room below. Figure 1 contains a drawing of the floor plan of the house.
Description of Previous Tracer Gas Testing
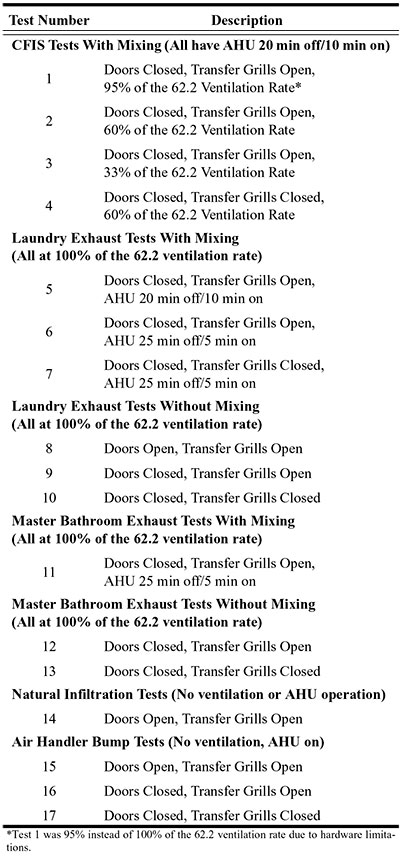
Hendron (2007) describes the tracer gas testing in detail. In total, seventeen ventilation tests were performed on the house using tracer gas decay methods. Table 1 lists the tracer gas tests performed. For each test, the house was first brought to a well-mixed state with uniform tracer gas concentration in all zones by running the central air handler (AHU) and auxiliary mixing fans. The test was initiated by deactivating the mixing systems and activating the ventilation system as appropriate for the test, and leaving the house in that state for a period of 2 to 14 hours. Three ventilation systems were tested. The first ventilation system tested was the central-fan-integrated supply (CFIS) ventilation system, which consists of an outside-air duct to the return side of the AHU and a controller that operates the AHU on a minimum duty cycle. The outside air duct contains a damper that remains closed except when the CFIS system is activated. The duty cycle of the AHU and CFIS system varied from test to test. This ventilation system was operated at different ventilation rates using a variable-speed fan installed inline with the outside-air duct, as described in Table 1. The second and third ventilation systems were upgraded exhaust fans located in the laundry room and master bedroom, respectively. The exhaust fans were tested only at 100% of the ASHRAE Standard 62.2-2003 (ASHRAE 2003) (referred to elsewhere in this paper simply as 62.2) ventilation rate, and were tested with and without simultaneous operation of the AHU for mixing. In addition to the ventilation tests, natural infiltration and air handler bump (natural infiltration with the AHU running) tests were also conducted. During the tracer gas tests, the bedroom doors were either open or closed. The house was built with transfer grills, which are passive openings above the doorways that allow a return air path when the bedroom doors are closed. The transfer grills were also either open or closed (taped over) during the tracer gas tests. The doors to the bathrooms and laundry room were always open. All exterior doors and windows were always closed.
Description of Modeling Software
CONTAM is a multi-zone air flow network modeling software developed by the National Institute of Standards and Technology (Walton 2005; Emmerich 2003; Emmerich 2001). It is commonly used in ventilation research to model buildings, ventilation systems, and contaminants in indoor and outdoor air (Emmerich 1995; Persily 1998). In CONTAM, the user specifies attributes of the building’s zones, air flow pathways between zones (such as leaks or fans and ducts), contaminant sources and sinks, and other relevant inputs. The software performs the simulation and the results are available for visualization or export.
Testing of Substitute House
At the time of the work described in Hendron (2007), an enclosure air leakage test was performed with a blower door (ASTM 2003), but no further diagnostics were performed on the house enclosure or interior demising walls as further work was not planned at the time. Later, when the decision was made to create a calibrated computer model, much more detailed information about the enclosure and interior airflow paths was needed in order to provide a reasonable starting point for the calibration process. The original house was no longer available for testing, so another house of the same floor plan was tested instead. While two houses of the same floor plan can certainly have different leakage characteristics, these two houses were built within a few months of each other, by the same builder and likely the same subcontractors, and the overall enclosure leakage testing results were similar. The original house had a leakage rate of 1346 cfm (635 L/s) at 50 Pascals (0.2 in. of water) pressure difference across the enclosure (CFM50), and the substitute house had 1608 CFM50 (759 L/s at 50 Pa). The substitute house was slightly larger due to an option that added two additional bedrooms and an additional bathroom; after subtracting the leakage in the additional bedrooms, the substitute house was 1411 CFM50 (666 L/s at 50 Pa). As the substitute house was simply a starting point for calibrating the model, differences between the houses were of minor consequence and were remedied during the calibration process.
Air leakage characterization on the substitute house was performed to quantify both house-to-exterior and room-toroom leakage characteristics. The testing also included tests of zone pressures and central forced-air system airflow to each room. The testing procedure was able to quantify the leakage characteristics of each room to the exterior and to neighboring zones, but no attempt was made to identify the specific locations of leakage within each room. Further details of the testing at the substitute house are included in the appendix.
Modeling Procdure
The goal of the modeling was to produce a set of inputs for the house enclosure and zone-to-zone leakage pathways that, when simulated with CONTAM, would produce the same results as the tracer gas tests when the ventilation systems were operated in the same manner as each of the tracer gas tests.
As a starting condition, leakage values calculated from the leakage testing in the substitute house were used for the exterior enclosure and the interior partition walls. Because the actual leakage locations within each room were not determined by the testing, leakage within each room was initially distributed proportional to the wall and ceiling area. Wall leakage was broken into leakage for each wall orientation and into five vertical locations on each wall, with equal vertical separation between the locations. Each leakage location on a wall had the same leakage coefficient and exponent. Initial test runs with simplified models showed the vertical spacing chosen (5 leaks per wall, equally spaced on a 9 ft (2.7 m) wall) approximated diffuse wall leakage, while still maintaining a manageable number of leakage elements in the model. The temperature in each room and the outdoor temperature and wind speed had been recorded during the tracer gas testing, and were used as inputs to the model. Wind direction was not recorded during the tracer gas testing, so meteorological data from the nearest airport (Auburn, CA, approximately 10 miles (16 km) away) was obtained and the wind direction data was used as an input to the model. Drawings and specifications for the AHU and duct system were obtained from the subcontractor, which were used to create a full duct and AHU model. The AHU and all ductwork in this house are located within conditioned space, greatly simplifying the need to characterize duct leakage. For each test simulated, a schedule was created that controlled the ventilation systems, AHU operation, and transfer grill and bedroom door status to replicate operation as performed in the tracer gas tests. Results from the model were compared to the tracer gas data and the leakage inputs were modified via trial-and-error to decrease the error between the model output and the tested data. No formal method was used to obtain a minimized error function, only visual comparison of the measured and simulated tracer gas decay curves, so there is no reason to assume that the final inputs represent a unique or optimized solution.
During the initial comparisons of measured and simulated data, it became clear that the most difficult tests to replicate were the tests with large differences in tracer gas decay rates between the different rooms. Stated differently, it is easier to replicate the decay rate in a well-mixed house (which might be approximated as a single well-mixed zone) than it is to replicate the decay rates of six interconnected zones. Consequently, a single test was used for the calibration, and the remaining tests were used after the calibration was complete in order to evaluate the results. The test used to calibrate the model was test 9, which utilized the continuously-operating laundry room exhaust fan as the ventilation system, did not have mixing via the AHU, and had the bedroom doors closed and the transfer grills open. Test 9 was selected as the calibration test because it was a long test (14 hours) without mixing, there were substantial differences in the tracer gas concentrations, and it had an interesting change in tracer gas decay rate during the test due to a temperature change in two of the zones.
Figure 2 shows the tracer gas decay curves from the initial simulation of test 9 using the enclosure leakage values calculated from the substitute house. The results are not unreasonable, yet clearly there is room for improvement. Figure 3 shows the results of the final simulation of test 9, which were deemed to agree with the measured data sufficiently to cease further trial and revision of the model.
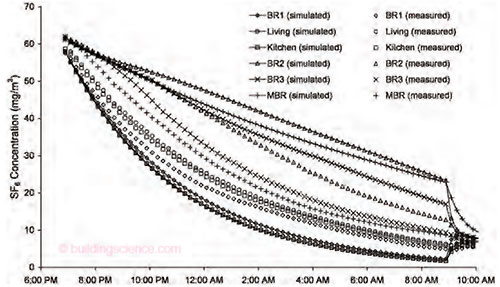
Figure 2: Results of simulation of test 9 using initial data from the substitute house.
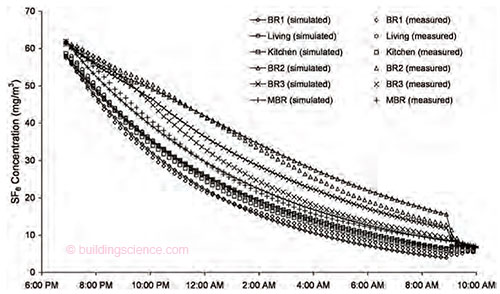
Figure 3: Results of simulation of test 9 after trial and error calibration of the model.
Statistical Method for Evaluation of Modeling Results
Results were evaluated statistically using ASTM D5157-97 Standard Guide for Statistical Evaluation of Indoor Air Quality Models (ASTM 2008). ASTM D5157 has three criteria relevant to evaluating the results of this work. The first criterion is that the data used for the evaluation should be independent from the data used to develop the model. All of the test results with the exception of test 9 meet this criterion, as they were not used to calibrate the model. The second criterion consists of a set of quantitative parameters related to the agreement between the predicted (modeled) and observed (measured) data sets. These parameters are:
- Correlation coefficient, r, between the predicted and observed data sets. r ranges from -1 to +1, with -1 indicating an inverse relationship, 0 indicating no relationship, and +1 indicating a strong relationship between the . . .
Download complete document here.