This paper examines methods of using hygrothermal models, primarily WUFI, to assess the impact of energy efficient enclosure upgrades on the durability of historical buildings. Means of producing and choosing input data for the hygrothermal simulation are discussed. Methods for using the hourly results from the simulations to generate a corrosion index and a freeze-thaw count are developed. An example wall is used to demonstrate the type of output that can be expected and how this can be used in making retrofit design decisions.
Introduction
Increased energy costs, decreasing energy security and fossil fuel reserves, and a growing awareness of the environmental impact of energy use in buildings has resulted in a renewed interest in energy efficiency. Space heating (and even cooling) of buildings is a major consumer of energy, and energy flows through the opaque vertical enclosure (walls) can be responsible for 20 to 50% of the heating/cooling load. There is a growing number of large masonry buildings built in Canada before the middle of the century that owners wish to renovate. Historical significance, increased energy costs, re-urbanization of city centers, and enhanced appreciation of traditional building architecture have generated the need.
A common potential retrofit option considered that can reduce energy consumption in this type of building is an interior retrofit that increases wall insulation and air tightness levels. Such retrofits also allow for a renewal of the interior finishes and distribution of services, important features in creating more useful buildings. It is desirable if renovations of any type can improve durability, indoor air quality, and comfort. Although exterior insulation retrofits are often much easier to design and easily meet most performance objectives, they change the appearance of the exterior and hence are usually not acceptable. This paper only investigates interior retrofits.
It should be noted that other energy-saving retrofit options should be considered in parallel with increased wall insulation. Such options include equipment changes (to more efficient models), window replacement, roof insulation upgrades, and no change at all (for situations in which energy consumptions reductions are impractical to achieve).
Changes in wall insulation and air tightness also bring about changes in the temperature and moisture conditions within walls, and in some cases have been blamed with causing reductions in durability. Regardless of the energy savings realized, it is important to ensure that retrofits undertaken for energy efficiency do not adversely affect wall durability. The durability aspects that are of the most importance for historic masonry buildings include freeze-thaw resistance,
efflorescence (caused by salt transport), corrosion (especially of masonry steel ties and embedded structural steel), and rot of embedded wooden components.
The extent to which enclosure wall retrofits can improve, or degrade, durability is a function of both the change in temperature and moisture conditions and the response of the materials that make up the wall. Hygrothermal computer models aim to simplify the former and material damage models are simplifications of the latter.
The moisture and temperature conditions within an enclosure wall are a complex function of parameters such as material properties, indoor and outdoor environmental conditions, mechanical system performance and occupant activities. To account for all such variables, computerized hygrothermal modeling tools can be used to help assess the change in wall performance as a result of the retrofit activities. It has been previously shown that hygrothermal computer simulation models can predict moisture and temperature conditions with a reasonable degree of accuracy (Kuenzel 1994, Straube & Schumacher 2003); however, these predictions do not directly provide an assessment of the durability risks without an understanding of each materials response and interaction with adjoining materials.
However, despite the value of modeling, its using in making retrofit decisions is limited by various factors, including uncertainty or simple lack of knowledge about boundary conditions (climate and exposure) and material properties. A major question is what damage models / performance thresholds should be used to guide the interpretation of the model results.
This paper reports on the assessment, using hygrothermal computer models of the durability implications of energy efficient retrofits wall assemblies used in older Canadian (and northern United States) buildings. Methods of generating weather files and analyzing the data using very simple and approximate damage functions are discussed. A single example of a typical solid masonry wall exposed to the climate of Halifax, Ottawa, Toronto, Winnipeg and Vancouver is presented.
Hygrothermal Modeling Approach
Figure 1 shows the flow of information that is required for a typical modeling exercise (Straube & Burnett 2005). The arrangement and geometry of the enclosure to be modeled is usually known, but significant simplifications must be made: 3-D assemblies approximated as 1-D, cracks and air gaps ignored and lumped into macro properties, etc. The combination of physics and numerics are embodied in the choice of the computer model. The choice of boundary conditions and material properties are major decisions made by the analyst/modeler. Finally, the interpretation of the results requires engineering judgment and an understanding of the inner workings of the models and material response.
The simulation package WUFI3.3 Pro will be used (Kuenzel 1994) in this paper as the authors have had the most experience and success with this package. WUFI is one of the most advanced commercially available hygrothermal moisture programs in use today. Its accuracy has been verified against numerous full-scale field studies of enclosure performance (roofs, walls, foundations, parking garage decks, etc.) over a number of years (e.g., Straube & Schumacher 2003). It is one of the few models in the public domain that can properly account for rain absorption and different water absorption/redistribution for arbitrary material data and boundary conditions. Given the appropriate material data, WUFI calculates heat and moisture flow every hour under the influence of sun, rain, temperature and humidity (see also www.wufi.de ). The analysis is, however, only as accurate as the input and the interpretation.

Figure 1: Modeling Approach (Straube & Burnett 2005)
Air Leakage Condensation and Drying
The WUFI model does not predict air leakage induced wetting and drying. This is difficult to account for primarily because the leakage path and driving forces are unknown, and are generally unique. The time scale of wind-induced air leakage is also much shorter than one hour. In all of the cases studied in this project it has been assumed that air leakage across the enclosure has been substantially controlled by standard air sealing techniques. It is not reasonable to attempt to design a retrofit with a significant amount of air leakage. However, experience has shown that air barrier systems formed of spray polyurethane products and fully-adhered membranes are more likely to achieve airtightness than drywall over batt spaces.
In typical retrofit situations, air leakage testing should be carried out to identify air leakage paths and to subsequently confirm that air sealing was successful. (Note that one can make an assessment of the air leakage potential by calculating the difference between the predicted temperature of a likely condensation plane such as the inside face of the sheathing or cladding and the interior dewpoint temperature. This is a very conservative method and will always over predict condensation.)
Boundary Conditions: Climate and Exposure
The exterior climate is clearly critical to enclosure wall durability. Five Canadian cities, representing large building markets with a stock of historical buildings and different climate zones are studied in this paper: Halifax, Ottawa, Toronto, Winnipeg, and Vancouver. The former three are wet (over 600 mm per year of precipitation) and have many days with freezing temperatures. Winnipeg is a very cold (average January temperature of -18 C) but dry climate. Vancouver experiences significant amounts of rain, but very few days of freezing weather.
Weather Files
Although WUFI includes some weather files, in some cases, weather files are not available for the project in question. Test Meteorological Years (TMY) Canadian Weather years for Energy Calculations (CWEC) or Weather Years for Energy Calculations (WYEC) files can often be used as these data files are readily available to most practitioners. Such files contain hourly weather data in a consistent form based on many years of real weather data. In general, the most problematic issue is converting the rain flags in the data file to rain fall rates. This can be done by applying average values to each flag and then correcting for annual or monthly average results (Straube 2005).
Note that most weather files are not extreme weather years, but rather average conditions of temperature and solar radiation intended to generate long term average energy consumption values for buildings. Some years will tend to result in worse conditions and some will result in more favorable results. It has been the experience of the authors that the role of driving rain and interior humidity is greater than the variation of performance between abnormally cold or abnormally warm years. Hence, we believe that the use of average year weather data is acceptable.
Driving Rain
The driving rain load is the largest moisture load in most climates for enclosures with absorptive claddings (e.g., wood, stucco, and masonry). The driving rain was calculated by combining the wind speed, wind direction and rainfall rate for each hour using the method described and validated by Straube & Burnett (2000). For all cases a Driving Rain Factor (DRF) of 0.25 and a Rain Deposition Factor (RDF) of 1.0 was used. This represents a relatively high exposure to driving rain (equivalent to the upper edges and top vertical edges of an exposed building). For a three-storey building in a built-up urban exposure, the RDF will be less than 0.5 over much of the façade. However, uncontrolled drainage from windows or other building features can increase the RDF significantly, and these areas of concentration must be avoided in the design and construction of details. The rain deposited over most of the center of a building face or lower down the face where protected by surrounding buildings will reduce the rain deposition factor to 0.1 to 0.5.
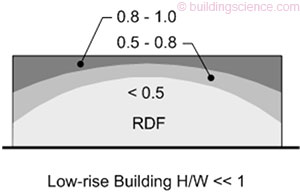
Figure 2: Distribution of Rain Deposition on Buildings
In using the WUFI model, a slightly different and more empirical approach is taken, also with two factors. If the R2 rain factor in the orientation section is used as the DRF and the Rain Water Absorption Factor in the surface transfer section is used as the RDF and, exactly the same results can be calculated. We have found this a successful means of comparing WUFI calculations to measured data.
Orientation and Climate
The orientation of a wall will often have a significant effect on the exposure of the enclosure to wind, rain, and sun. As it is often onerous to conduct simulations of each orientation, it is desirable to pre-select the critical orientation based on a climate analysis. To this end, the climate for each site should first be analyzed by calculating driving rain direction and intensity, temperature, and relative humidity, solar radiation, wind speed and wind direction frequency. Driving rain was given the most importance, but solar radiation is also important, as it increases the drying capacity of masonry and elevates the temperature (which reduces freezing).
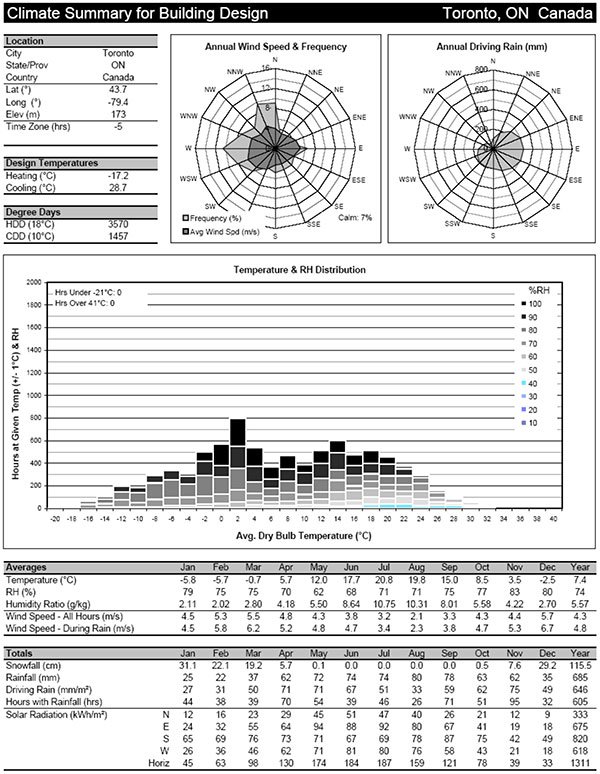
Figure 3: Climate Summary for Toronto, Canada
Climate summaries for each city can be developed, (including temperature, driving rain and solar exposure) and are presented for one climate (Figure 3). Each climate zone has a somewhat different direction for peak driving rain, and all are affected similarly by solar gain variations. Based on preliminary runs and inspection of the climate summaries, the worst-case direction was chosen for each climate. The choices are summarized in Table 1. It can be seen that the directions can vary. The newer versions of WUFI (version 4.0 and higher) provide tools to conduct some of this preanalysis within the program itself. . .
Download complete document here.